
Blood: The Good, the Bad, and the Ugly
Hematopoiesis
Blood is a fluid that transports and delivers nutrients and oxygen to body cells, and removes metabolic waste to be excreted. In vertebrate animals such as ourselves, blood is composed of several different types of cells (the cellular components) suspended in a watery liquid called plasma which contains dissolved solutes and proteins (the humoral components), including immunoglobulin proteins called antibodies. Both the cellular and humoral components of blood are transported throughout the body via the cardiovascular and lymphatic systems.
Cell-mediated immunity
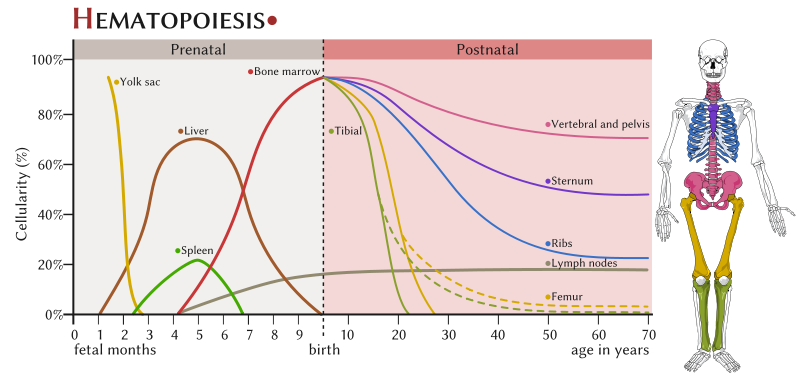
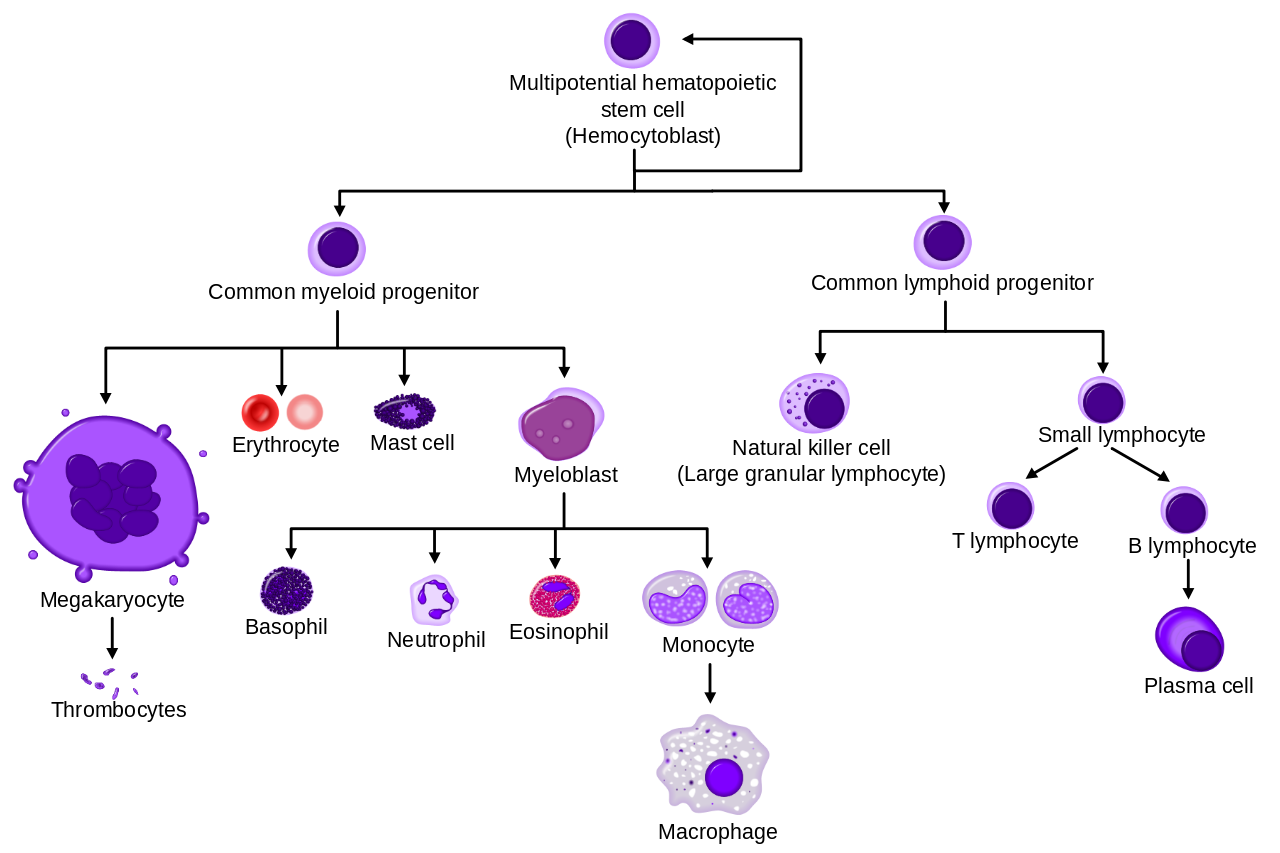
The production of blood cells is called hematopoiesis and occurs throughout our lifetime, primarily in the bone marrow and in the lymph nodes after birth. Blood cells originate as “stem cells,” which become committed to differentiate into mature cells along one of two different paths: myeloid or lymphoid.
Found most abundantly in blood are the erythrocytes (red blood cells), which derive from the myeloid cell line. These are highly specialized cells filled with hemoglobin designed to transport respiratory gases to and from the lungs. Another type of cell that derives from the myeloid line are megakaryocytes, which produce thrombocytes (platelets).
Leukocytes (white blood cells) are our primary cellular system of defense against disease. White blood cells circulate and patrol the blood and tissues, where they encounter and examine foreign entities invading the human body, sometimes engaging in mortal combat.
Leukocytes are derived from either the myeloid or lymphoid cell lines. In general, the cells in the myeloid cell line play a key role in the innate (also called “nonspecific”) immune response. Myeloid white blood cells include granulocytes (neutrophils, eosinophils, and basophils) and monocytes. These are primarily phagocytes that hunt down, engulf and destroy invading entities, while sending messages to other types of immune cells that an invasion has taken place. The innate response also includes humoral components, such as complement. The majority of bacterial infections that breach the security of our skin and mucous membrane barriers are dealt with swiftly and effectively by our innate immune response.
Cells in the lymphoid cell line, called lymphocytes, are activated via signals received from myeloid cells. Lymphocytes launch the adaptive (also called “specific”) immune response. Lymphoid cells differentiate into natural killer (NK) cells, T-cells and B-cells. When activated, B-cells differentiate into plasma cells which produce antibodies.
| Cells involved in the adaptive immune response | Cells involved in innate immune response |
Humoral immunity
The term “humoral” refers to the liquid portion of the blood. Although both innate and adaptive immune responses have humoral components, use of this term is most closely associated with the production of antibodies as the culmination of the adaptive immune response.
Antibodies (also called immunoglobulins) are proteins that recognize and bind specifically to foreign structures associated with cells or objects, which are called antigens.
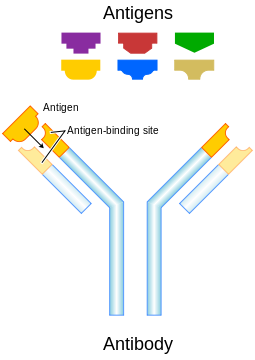
Antibodies have unique molecular structures designed to match with only one type of antigen. Antibodies bind to and neutralize antigens in several ways.
Antibodies are produced by B-cells after they are activated by signals from other immune cells. Activated B-cells undergo rapid growth and produce a clone of cells all producing one specific type of antibody molecule.
A subpopulation of the activated B-cells develop into memory cells, which “remember” the antigen. Memory cells are primed and ready if the antigen is encountered again. This provides the biological basis for vaccination, in which the immune system is artificially exposed to an antigen without triggering disease. Antibodies and memory cells are produced as if the exposure was to the actual antigen, and this provides future protection against the actual disease.
Antibody molecules persist in the blood and may continue to circulate for months to years after the antigen exposure occurred. Both the antibodies, and microbial antigens themselves, can be detected and measured in laboratory tests called immunoassays, which can aid in the diagnosis of an infectious disease.
The overall human immune response is exquisite and enormously complex, and is actually a course unto itself. Characteristics of each of the two “arms” of the human immune system are summarized in Table 1. Our goal in microbiology is to better understand the types of interactions that occur when the immune system encounters harm-causing microbes, but it’s also important to understand immunity from the perspective of the home team (our commensals) as well.
| Table 1. The two arms of the human immune system. | |
| Components of the Human Immune System | |
| Innate Immune Response | Adaptive Immune Response |
| Response is non-specific | Specific for pathogen or other antigen |
| Immediate maximum response | Lag time before maximum response |
| Cellular and humoral components | Cellular and humoral components |
| No immunological memory | Exposure leads to immunological memory |
| Found in nearly all forms of life | Found only in jawed vertebrates |
Antibodies as an indirect indicator of an infectious disease
Serological tests for antibodies or antigens in blood are widely applied in clinical laboratories because they provide evidence of infection. Detecting antibodies in a patient sample is not necessarily a direct indication that the person has a disease, but rather shows past or present exposure to the disease-causing agent.
Infectious mononucleosis (IM), a disease that may follow infection with Epstein-Barr virus (Human herpesvirus 4) or Cytomegalovirus (Human herpesvirus 5), is an example of a fairly common disease often diagnosed on the basis of detection of antibodies in a person’s blood. One type of immunoassay for IM detects “heterophile” antibodies in a patient’s serum. These are weak, early, broad specificity IgM class antibodies produced against poorly defined antigens, which happens to include cow, pig, and horse red blood cells. The reaction between heterophile antibodies and animal red blood cells results in “hemagglutination,” or clumping of the red blood cells, which can be visibly observed.
For whatever reason, people with infectious mononucleosis and a few other infectious diseases (hepatitis and rubella) have elevated levels of heterophile antibodies. They sometimes cross-react with “self” antigens, and may also be found in people with autoimmune disease.
Use reliable internet sources to research the clinical signs and symptoms consistent with a diagnosis of infectious mononucleosis (IM) and compile a list below.
__________________________________________________________________________
__________________________________________________________________________
__________________________________________________________________________
__________________________________________________________________________
We will be performing a commercially-available qualitative assay for detection of heterophile antibodies as an indicator of infectious mononucleosis. Your instructor will demonstrate how to perform the test, using positive and negative controls.
The method below corresponds to the Fisher HealthCare Sure-Vue Color Mono Test kit, but other kits may be substituted by your instructor. The Sure-Vue test kit uses specially treated horse red blood cells. If heterophile antibodies are present in the patient sample, the red blood cells will agglutinate which will appear as dark clumps against a colored background.
Clinical Scenario
A 16 year-old female patient reports symptoms that include a sore throat and feeling achy and overly tired. Clinical observations include a fever of 102°F and swollen lymph nodes in the neck region. The initial differential diagnosis made by the physician includes streptococcal infection (strep throat) and infectious mononucleosis. A blood sample is taken and tested using the Sure-Vue Mono Test.
To perform the test, you will need to obtain a test card, one patient serum sample, and a bottle of test “reagent” (a suspension of horse erythrocytes) from your instructor.
Place one drop of the patient sample inside the circle on the card. Shake the reagent bottle, and add one drop of the reagent next to the drop of patient sample.
Using a wooden toothpick, mix the two drops together thoroughly so that the combined drops completely cover the surface within the circle.
Rock the slide back and forth gently for 1 minute, then set it down on the lab bench and let it sit undisturbed for an additional 1 minute. Without moving the slide again, look at the circle to see if clumping is visible.
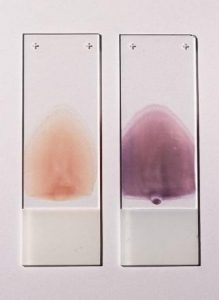
A positive reaction will have moderate-to-large sized dark clumps against a blue-green background, distributed uniformly over the surface of the test circle.
A negative result will show no clumping, although there may be a slightly graining appearance, against a greenish-brown background.
Was your patient sample positive or negative for this test? __________________
Based on the clinical signs and the result of the test, can the doctor be absolutely certain that the patient is infected by either EBV or CMV, and that the infection is causing infectious mononucleosis? Explain your answer.
__________________________________________________________________________
__________________________________________________________________________
__________________________________________________________________________
__________________________________________________________________________
Blood cell counts as indicators of health and disease
One way to evaluate a person’s (or animal’s) state of health is to directly or indirectly examine cells or metabolites found in blood. In clinical laboratories, levels of various metabolites in plasma may be measured by chemical assay, and blood cells can be distinguished and counted using automated methods.
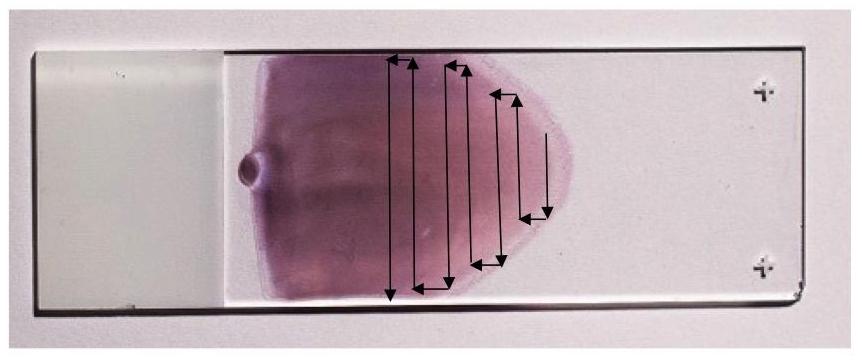
It is also possible to evaluate the cellular components in blood by directly observing them with a microscope. To be able to see individual cells, it is first necessary to create a very thin film of blood with a “feathered edge” (a single layer of cells) on a glass slide. Unstained and stained blood smears with a near perfect “feathered edge” are shown in Figure 4.
Once the blood smear is stained, the cells are visually inspected with a microscope. One of the most commonly used differential stains is the Wright-Giemsa stain, which stains red blood cells a pinkish-red color, and stains the nucleus and cytoplasm of white blood cells various shades of purple. Stained blood smears are examined to evaluate the appearance of the blood cells, and to count the number of different types of white blood cells present. Blood smears may also be examined to see if the blood contains any protozoal or bacterial pathogens associated with disease.
From an infectious disease perspective, the number of white blood cells and the relative percentages of different types of cells may indicate whether a person has a disease. This can be noted as a departure (either higher or lower) from established “normal” values.
Normal ranges, expressed as a percent of total white blood cells, are provided in Table 2—note that these values vary across age and gender and are therefore only approximations provided for the purpose of this lab. The absolute number of white blood cells generally considered “healthy” ranges from 3.5 to 11 x 109 cells/L.
| Table 2. Normal ranges for white blood cells in peripheral blood. | |
| White blood cell type | Range of relative values for “normal” |
| Neutrophils | 50–75% |
| Lymphocytes | 15–35 % |
| Monocytes | 3–10% |
| Eosinophils | 1–7% |
| Basophils | 0–2% |
Deviations from these “normal” values can be an indication that an active infectious disease or a blood-associated disorder is ongoing.
For the types of white blood cells listed in the table below, research what disease conditions are associated with a relative increase or decrease in the numbers of that particular cell type:
| White blood cell type | Conditions associated with a relative increase | Conditions associated with a relative decrease |
| Immature neutrophils, in which the nucleus looks like a single “band” | ||
| Lymphocytes | ||
| Eosinophils | ||
| Basophils |
To determine the relative percentages of the different types of white blood cells found in a person’s blood, it’s important to first know what each cell type looks like and be able to tell them apart. These will be shown in the lab and/or provided as handouts before you start your investigation.
The Differential White Blood Cell Count (a “Diff”)
When a differential cell count is performed in a clinical lab, the technologist first makes a blood smear either manually or by machine, hoping to achieve that perfect feathered edge. Smears are routinely stained with Wright-Giemsa stain, and this is the staining method used to prepare the slides we will be viewing in this lab.
After staining, the smear is observed with a light microscope using the oil immersion objective lens. An initial scan to evaluate the appearance of the red blood cells and platelets is performed, followed by a more detailed analysis of the populations of white blood cells present.
To determine the relative number (percent) of each type of white blood cell, the smear is scanned using a pattern that prevents the observer from counting the same cells more than once. As each white blood cell is encountered, it is identified by cell type and recorded. A “tally” is kept and when the total number of cells observed reaches 100 the proportion of each type can be easily determined as the number of that cell type/100. The percent is calculated by multiplying by 100.
Obtain a prepared slide of a Wright stained blood smear from the front bench. Using the scanning pattern illustrated in Figure 5 and as demonstrated, scan the entire slide. Identify and count each white blood cell you see, until you have reached 100 cells.
Using a cell counter (if one is available in your lab) makes the tally process a little easier. Record your results in the table below:
| White blood cell type | Number of cells | Percent |
| Neutrophils (including bands) | ||
| Lymphocytes | ||
| Monocytes | ||
| Eosinophils | ||
| Basophils |
Based on the results of your differential cell count, provide an analysis in terms of how the blood compares to the “normal” values. What do the results suggest about the overall state of health of the patient? Provide at least three specific examples from among your results to support your opinion.
__________________________________________________________________________
__________________________________________________________________________
__________________________________________________________________________
__________________________________________________________________________
Staining methods to detect pathogens in blood
Although blood is generally thought of as a “sterile” tissue, some viruses, bacteria, protozoa and helminthes may actually live in blood cells and circulate throughout the human cardiovascular system. Infections of the blood can range in severity from a transient bacteremia (bacteria in the blood) to septicemia, a “septic” state which may result in severe illness and death.
Invading microbes in blood are usually attacked, destroyed and removed by the immune system as quickly as possible. However, we know from research that some highly adapted microorganisms may survive and even reproduce within blood cells. To accomplish this feat, the microbes must “convince” the immune system to leave them alone by either evading or subverting the innate or adaptive responses.
Although parasitic blood infections such as malaria and heartworm are relatively well known, it is becoming increasingly obvious that bacteria also cause long term infections that can lead to chronic disease. Two examples of bacteria that infect and reproduce inside blood cells include Rickettsia spp. (Rocky Mountain Spotted Fever) and Bartonella spp., (best known for causing a disease referred to as “Cat Scratch Fever”). Both of these bacteria and several others are zoonotic diseases that have “spilled over” into humans. Most are transmitted to humans by insect vectors such as fleas, lice, and ticks.
To survive in blood, bacterial pathogens must first evade capture and destruction by phagocytic cells. One successful approach is for the pathogen to infect and then reproduce inside the very cells that were sent to destroy them. This and other strategies used by bacteria are referred to as “stealth pathogenesis.” Attack strategies employed by stealth pathogens are fundamentally different from those used by the better known “frontal” pathogens, whose major tactic is to breach the host perimeter, reproduce and spread as quickly as possible before the immune system can rally for a response. Table 3 compares and contrasts these two strategies for host invasion and infection.
| Table 3. Characteristics of Frontal versus Stealth Pathogens | ||
| Frontal Pathogens | Stealth Pathogens | |
| Incubation period | Short (hours to days) | Long (months to years) |
| Symptoms | Acute | Chronic |
| Immunity | Sterilizing | Non-sterilizing |
| Transmission | Direct | Indirect (vector) |
| Reproduction | Rapid | Slow |
| Carrier state | Uncommon | Common |
| Note. Adapted from “Front and stealth attack strategies in microbial pathogenesis” by D. S. Merrell and S. Falkow, 2004, Nature, 430, p. 250-256. Copyright 2004 by Nature Publishing Group. | ||
Using stealth tactics, some microorganisms are able to invade their hosts, disseminate to parts of the body that have poor immune surveillance, evade phagocytosis and disarm the adaptive immune response. Many stealth pathogens that infect blood cells also have the ability to infect multiple types of animals, and are transmitted among hosts by blood-sucking insects.
We will be looking for evidence of infection by stealth microbes that reproduce inside of various blood cell types, by examining Wright-Giemsa stained blood smears.
Anaplasma spp.
Anaplasma spp. are stealth bacteria that invade red and white blood cells. Examples include A. centrale in cows, which invade red blood cells, and A. phagocytophilum in humans and other animals, which reproduce inside phagocytic white blood cells.
Although bacteria are presumed to have relatively simple lives, Anaplasma and other stealth bacteria have complex life cycles. Humans and animals are infected through the bites of a tick, which carry Anaplasma as well as a mélange of other disease causing agents, including Borrelia (Lyme disease), Ehrlichia (ehrlichiosis), and viruses that cause encephalitis in some patients.
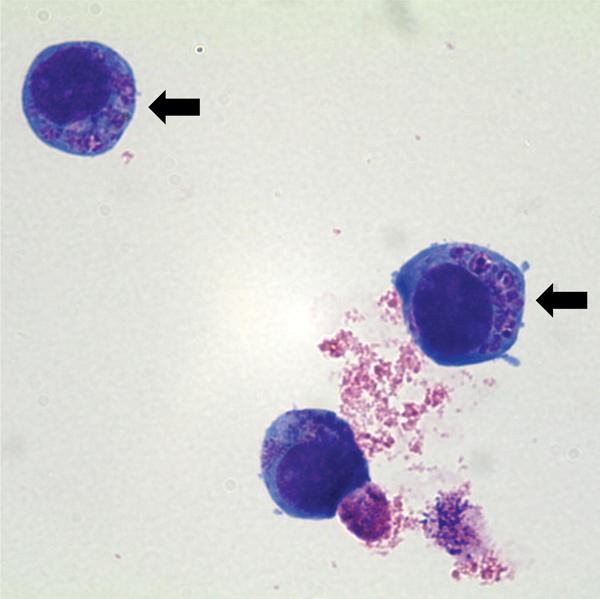
Once in the blood, A. phagocytophilum binds to surface proteins on neutrophils and other granulocytes. After phagocytosis, the bacteria send signals that inhibit the development of a phagolysosome, and then are free to reproduce inside the endocytic vacuole (called the endosome).
This forms an observable structure, called the morulae, inside the infected cell (indicated by arrows in Figure 6), which can be seen by a careful observer on a Wright-Giemsa stained blood smear.
Obtain a stained blood smear slide labelled Anaplasma. Scan the slide using the oil immersion objective lens and when you encounter a phagocytic cell type, look closely at the cytoplasm and determine if there are morulae, which will stain light purple against the darker blue of the cytoplasm.
Keep a tally of the number of phagocytes you observe, both with and without morulae. Record your results in the table below:
| Morulae of Anaplasma observed? | Number of cells with morulae | Number of cells without morulae | Percent of infected phagocytes |
Babesia spp.
Babesia spp. are protozoa classified as Apicomplexa, a group that also includes the better known Plasmodium, which causes malaria, and Toxoplasma, which causes toxoplasmosis.
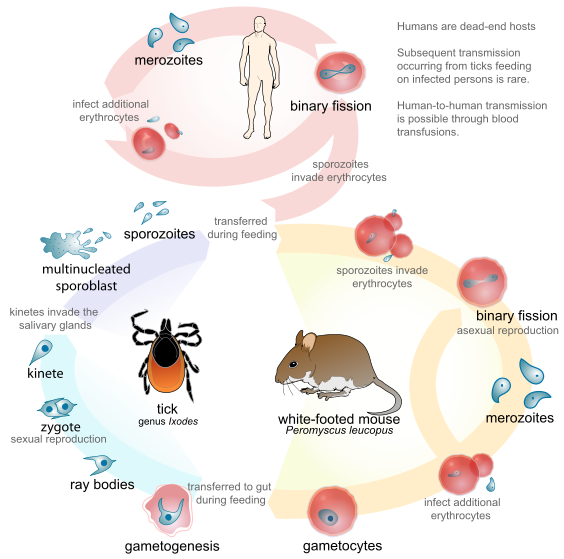
Babesia has a complex life cycle that includes more than one life stage cycling through multiple hosts, as illustrated in Figure 7. Ticks introduce sporozoites into their host when they attach to take a blood meal. Sporozoites invade red blood cells and develop first into trophozoites, then merozoites, which are released and infect nearby red blood cells to perpetuate the cycle.
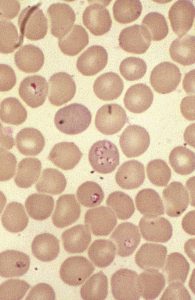
The trophozoites and merozoites can be observed both inside and outside of the cells in a Wright-Giemsa stained blood smear. Inside the red blood cells, the developing trophozoites take the shape of “rings” or “crosses” that stain purple and generally stand out distinctly from the red cell background, which is a pinkish color. The merozoites appear as amorphous blobs with a dark purple dot, which is the nuclear material of the parasite.
Obtain a stained blood smear slide labelled Babesia. Scan the slide using the oil immersion objective lens, and look for evidence of Babesia infection, both inside and outside the red blood cells. Move to the thinnest part of the smear, where you can see a single layer of the red blood cells. Start counting the number of red blood cells, keeping track of the cells with obvious signs of trophozoite development and any extracellular merozoites. Continue to count until you’ve counted 100 cells. Use this data to estimate the level of parasitemia.
| Number of red cells with Babesia trophozoites | Number of merozoites observed | Estimated level of parasitemia (trophozoites/merozoites observed per 100 cells counted) |
According to a scholarly source (and cite the source), approximately what percentage of people in the United States are infected with Babesia, but may be asymptomatic or experiencing mild or chronic non-specific symptoms?
__________________________________________________________________________
Reflect on the implications this might have on the supply of blood for blood transfusions available in the United States.
__________________________________________________________________________
__________________________________________________________________________
__________________________________________________________________________
Dirofilaria
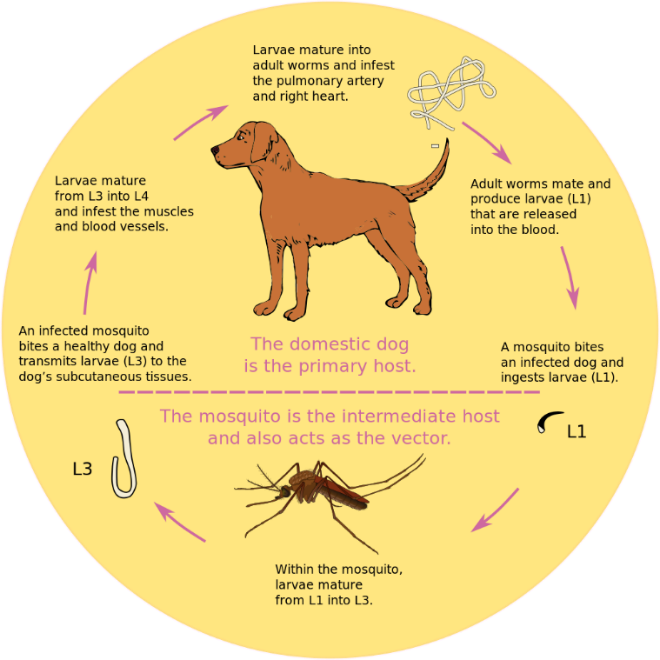
Dirofilaria are nematodes (roundworms) also known as heartworms.
Dogs and cats are both known to be hosts for this type of parasitic worm, and heartworm control is a primary concern for pet owners and veterinarians alike.
Adult heartworms live in the right ventricle (one of the chambers) of the heart in dogs, and in the pulmonary arteries of cats. The adult worms produce microfilaria (“baby” heartworms) which can be seen in blood smears. Complications of an active heartworm infection in dogs range from nonexistent in early or mild infections to coughing, vomiting, trouble breathing and heart failure in advanced infections.
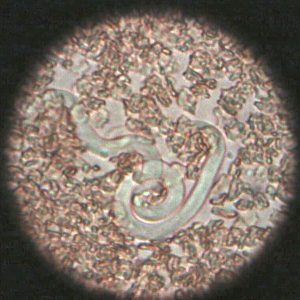
Obtain a stained blood smear slide of Dirofilaria. Scan the slide using the oil immersion objective lens, and look for the microfilaria worms which will be obviously larger than the blood cells. Figure 10 shows a picture of a single microfilaria in unstained blood as observed by bright field or phase contrast microscopy. In a Wright-Giemsa stained smear, the microfilaria look like worms, only stained blue and purple. Note the size of the microfilaria worm in relation to the red blood cells (which are approximately 10 µm in diameter). Adult heartworms may grow to be 20–30 cm long.
Scan the entire slide, and keep track of the number of microfilariae you see.
How many individual microfilariae did you find in the blood smear? ________________________
Consider that the drop of blood from which the smear was originally made had a volume of less than 10 µl. Dogs are estimated to have approximately 80–90 ml of blood per kg body weight.
For a dog that weighs 100 lbs (45 kg), estimate how many microfilariae would be found in its circulation, using a value of 85 ml of blood per kg body weight.
__________________________________________________________________________
__________________________________________________________________________
__________________________________________________________________________
