
APPENDIX C: Writing Tips for Discussing Results
The information provided in this section is applicable to discussing results for a formal technical report, an academic lab report, or just responding to technical questions. The information includes:
- How to calculate percent difference/error.
- Typical magnitudes of percent error for courses where circuits are constructed.
- What to consider writing about based on lab questions.
- Guidelines for graphs provided in a report.
- Considerations for technical responses.
Percent Difference/Error
The percent difference or percent error is necessary to fully comprehend the magnitude of the difference or error being evaluated. For example, if in discussing results I read “The voltage difference is 0.02V” and no percent difference analysis was provided, I could conclude this is a negligibly small difference. However, if the theoretical voltage was 0.085V and the measured value was 0.065V then the percent difference would be –31%! Whereas if the measured value was 0.58V and 0.6V was the expected value, then the percent difference is only 3.4%. Yet, both cases are for a 0.02V difference.
There are various ways to consider and calculate percent difference or percent error. Even how we refer to it varies! When comparing two values that are expected to be different, such as when comparing a theoretically derived value to an experimentally measured value, it is logical to refer to “percent difference”. When the discussion is focused on error, then it makes sense to refer to “percent error”. We certainly expect a difference when comparing theory to experiment because we expect the real world of the experiment to introduce variables not found in theory. Considering these variables as “errors” is more a point of view than a point of fact. For example, the tolerance of resistors in a circuit is a point of fact that introduces a likely difference between the theoretical resistor value and the actual resistor value. Thus, which phrase is used implies a bias on the results. When using “difference”, the implied bias is that the differences are all explainable and justifiable whereas using “error” implies fault. For the sake of this discussion, I will use the phrase “percent difference” demonstrating my particular bias as an engineer.
There are various ways of calculating percent difference that depend on the value that is perceived to be most valid and thus the one being compared against. Each of those ways is presented below. In a report, it is good practice to show a sample calculation of percent difference which serves to demonstrate to the reader the equation used.
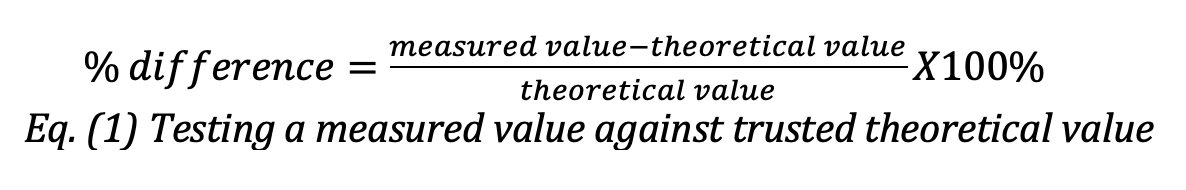
Equation (1) provides the formula most commonly used in academia. It is used when the purpose of the experiment is to validate a trusted theoretical principle used to calculate the theoretical value. In this case, the percent difference is an indication of how different the measured (or experimental) value is from the expected value based on theory.
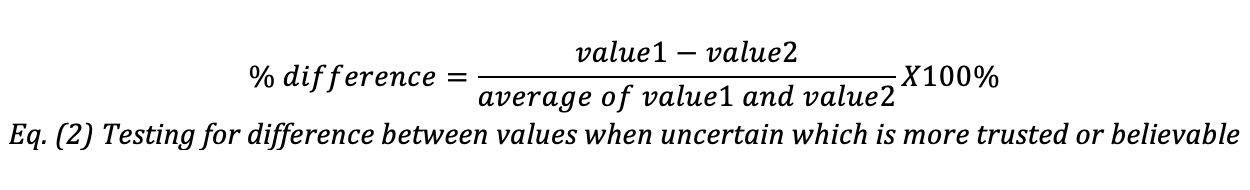
Equation (2) provides the formula used when the purpose is to compare two values without judgment as to which value is the most trusted or believable. That is generally not the case when comparing experiment to theory as the exp5erimenter, more often than not, has evidence to justify trusting one of the values more than the other. Equation (2) is commonly used when comparing two experimental values determined using two different methods.
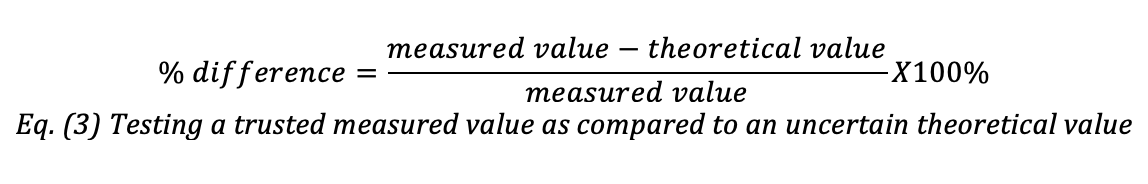
Equation (3) is used when the purpose is to test the theory’s validity, a more advanced prospect. This equation is used when the experimental observations are trusted but there is a question as to how accurately the theory employed predicts those observations.
In all these equations, the measured value is used interchangeably with the experimental value. This value is determined through experimentation. The theoretical value is determined from an analysis and does not depend on any measured value.
Significance of Difference
You must always provide reasoned discussion of percent difference. Significant difference depends on work undertaken and associated accuracy requirements. The degree of accuracy is likely limited by factor(s) beyond control of the experimenter. For any given experiment, the sources of error must be identified and quantified so that an acceptable range of percent difference is specified. Associating a percentage difference with an error source can be straightforward, in the case of manufacturer-supplied component tolerance, or may need to be estimated based on experience, past practice, or theory.
A common limitation that sets the acceptable range of percent difference is the tolerance of components as compared to their nominal values. For example, one may conclude that percent difference of 8% can be attributed to resistor tolerance for a circuit constructed with resistors that have a tolerance of 10% from the nominal value. Yet, this conclusion would not be acceptable if the resistor tolerance is 5%. One must be aware of all possible error sources but if those add a relatively negligible percentage, then those other error sources are considered comparatively small and insignificant. There is no reason to present to the reader insignificantly small error sources. If there are multiple significant error sources, each must be specified and the expected impact of the combination of error sources on the acceptable tolerance for results. Continuing with the example, many capacitors have a tolerance of 10%. Therefore, in circuits with resistors having 5% tolerance and capacitors with 10% tolerance, worst case error adds up to 15% so that all results within 15% of expected value are acceptable due to the combined tolerances of the resistors (5%) and the capacitors (10%). Keep in mind that components with tighter tolerances lead to a smaller acceptable range for the percent difference between measured and expected values.
If the percent difference between measured and expected values for a particular experiment is greater than the accepted percentage as determined from evaluating the error source, then one of three possible reasons should be considered. First, the percent difference could be an indication that the theory is not predicting the results as generally expected. In this case, there must be a reason to suspect flawed theory and it is important to determine any theoretical assumption(s) at fault. Second, an error source considered insignificant may, in fact, be introducing significant error. In this case, the error source must be identified and explained. If possible, action should be taken to mitigate the source of error. Third, a significant (and unacceptable) human error was made during experimentation in which case the experiment needs to be redone.
Recognizing that lab preparation always includes performing theoretical predictions first and may also include computer simulation, the experimenter MUST be in a position to judge the data as it is being recorded. If a large percent difference is noted during lab, do not proceed until the problem is resolved. Depending on the setting, this may include seeking assistance from the instructor, colleagues, or supervisor, and may require obtaining permission to proceed. Be aware that the most common source of error leading to percent differences outside the acceptable range is gross error in the lab which must be identified WHILE in lab.
Writing Discussion Based on Questions
When writing results and discussion section, pay close attention to all questions posed by the instructor in an academic setting or by colleagues or customers in a work setting. Generally, questions indicate aspects of the work considered most important and must be discussed along with the presentation of results.
Guidelines for Graphs
Presentation of results is almost always facilitated using graphs and/or tables. Refer to graphs and tables when discussing results. Construct graphs using the following guidelines:
- Create the graph using a computer software package such as Microsoft Excel. If computer access is not available, use grid paper.
- Clearly label axes, including quantity plotted and its units. Independent variable goes on the x-axis and dependent variable on the y-axis for a y-variable vs. x-variable graph.
- Use a smoothed line to produce the best-fit curve. Only use a trend line when you are looking to provide a polynomial equation to approximate the observed behavior.
- Clearly indicate data points using a circle, triangle, or square. Use different shapes for different curves plotted on the same axes.
- Label different curves plotted on the same axes.
- Number and title every graph. “Figure 1: V vs. R” is NOT an acceptable title whereas “Figure 1: Measurement of Voltage (V) as a Function of Varying Resistance (R)” is.
- Place all graphs in the report so that the bottom of the graph is either along the bottom of the paper or the right side of the paper.
Considerations for Technical Responses
The list provided below supplies guidelines for answering technical questions as opposed to writing a formal technical report. Keep in mind that this a “short list”. You should also make sure to ask yourself the questions posed in the “Questions to Ask Yourself Prior to Submitting Any Report” section of the guidelines.
- First type the question, then type the answer. In other words, always provide the question with the response. It is important for the reader to have the question being answered in front of them when considering your response.
- Make sure the underlying objectives are understood as they are the indication of what to focus on in answering questions and writing reports.
- Use full sentences and make sure all parts of the question are answered. If asked to explain, make sure to provide adequate explanation.
- When comparing data, supply the data AND the percent difference along with a meaningful discussion. The question need not explicitly ask for a meaningful discussion; that is implied when asked to make a comparison.
- When comparing data, make sure the type of data is clearly indicated. Data that is obtained completely from theory with no use of data collected in the lab is theoretical data. Data obtained from experimental measurements is experimental data. If theory was used to derive data, such as using current to calculate voltage using Ohm’s Law, the result is still experimental in nature since it is based on experimental information. Finally, data can be computer generated or simulated data.
- Tables or graphs should allow for easy comparison between numbers. Indicate the type of data and its units, and supply a percent difference where appropriate. All types of data should be included.
- If the responsibility of answering questions is a team responsibility, it is expected that ALL team members contribute to the discussion and writing of the answers. Ineffective teams will often default to assigning individuals to certain portions or questions just to copy them all together to form a single report. However, the result is often not a cohesive report and doesn’t take advantage of the varied skills and perspectives of the team.
- The recommended method of answering questions as a team is to organize a team meeting at which the team discusses what is needed to provide the responses and a plan for preparing a first draft. If a meeting is not possible, the team should engage in an electronic discussion and use Google docs. Individuals could be assigned to respond to particular questions. Several days before the team report is due, each individual must have completed their first draft contribution allowing time before the due date for everyone to review and revise the supplied responses.
- Google Docs allow a team to jointly work on a document, simultaneously adding content and editing existing work. Google Docs also allows editors to leave comments thus providing communication between team members concerning plans and feedback.
- Make sure to read over what you have written to see if it actually answers the question at hand. You may not be getting straight to the point, you may not be backing up your answer with meaningful information, or you literally may not be answering the question. It is not unusual to provide a response based on what you thought the question was asking and a critical re-reading of the question and the response can assure you don’t make that mistake.
