Learning Activities 9.1 – 9.2: Pressure Rate-of-Rise Curves
Summary of Learning Activities
Learning Activity 9.1: Taking Data
Learning Activity 9.2: Graphing Pressure Rate-of-Rise Curves
- Collecting data and plotting pressure rate-of-rise curves for rough vacuum systems without leaks or outgassing sources present.
- Collecting data and plotting pressure rate-of-rise curves for rough vacuum systems with a real leak and/or an outgassing source present.
- Differentiating between the presence of a real leak or an outgassing source based on the pressure rate-of-rise curve plot.
- Practice system pump down.
- Collect data and plot pressure rate-of-rise curves.
- Differentiate between the presence of a real leak and a source of outgassing present in the vacuum system based on the pressure rate-of-rise curve.
Suggested Pre-lab Assignment
None.
Theoretical Background
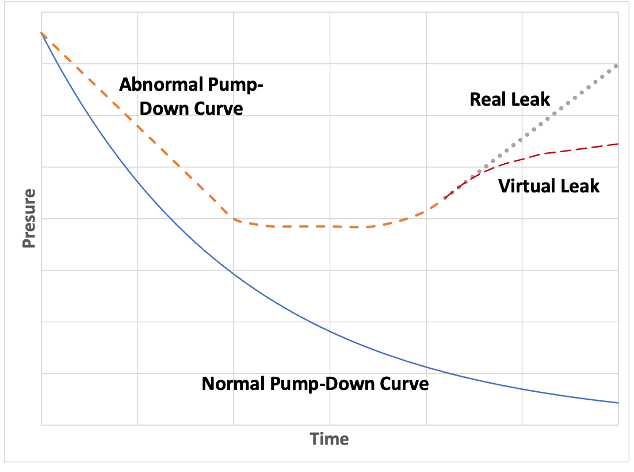
Vacuum pump-down curves and pressure rate-of-rise curves can be used to diagnose abnormal vacuum system performance. Figure 9.1 shows how a pump-down curve with a leak differs from the original pump down curve. Depending on the size of the leak, the final pressure may or may not be reached. If the leak is small, the system may be able to reach the desired final pressure, but it will take longer. With larger leaks, the target pressure may not even be achieved. Thus, a pump-down curve can help a technician identify that the vacuum system is operating abnormally, but it may not be very useful in differentiating between a real leak, a source of outgassing, or a virtual leak.
A real leak is present when gas can travel from the outside of a vacuum system to the inside. Real leaks can occur due to a broken gasket (O-ring), an improperly installed gasket, a bent centering ring, a hole in a weld, or from a malfunctioning pump. Outgassing originates from within the system, rather than from the atmosphere. Materials with high vapor pressures, contamination, residual water vapor, or backstreaming oil can cause outgassing within the vacuum system.
A disturbance present in the vacuum system and its type can be detected by performing a pressure rate-of-rise or “up-leak” test. First, the process chamber is pumped down to the desired base pressure. Then, the chamber is isolated from the vacuum pump and monitored for a rise in pressure over a period of time. The extent to which the pressure rises determines the type of disturbance present.
In Figure 9.1, a real leak is represented by linear rise in pressure after system is isolated from the pump. A virtual leak, on the other hand, slows down as pockets of gas, trapped in the system, are being exhausted. If there is no leak present, initially a very small increase in pressure will be detected, but it will be much smaller than in the system with real or virtual leak. The rise in the system pressure due to outgassing looks similar to the virtual leak.
Figure 9.2 show how the rate of rise of the pressure depends on the size of a real leak. The larger the leak, the steeper the slope of the plotted rate-of-rise curve.
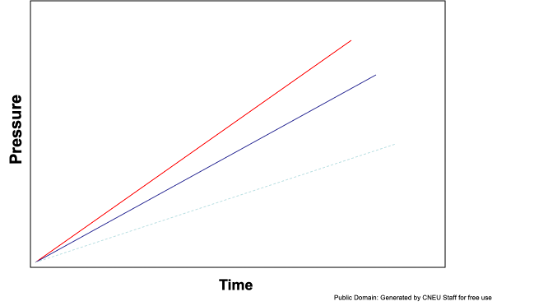
Figure 9.3 shows a typical rate of pressure rise when outgassing is present in the system.
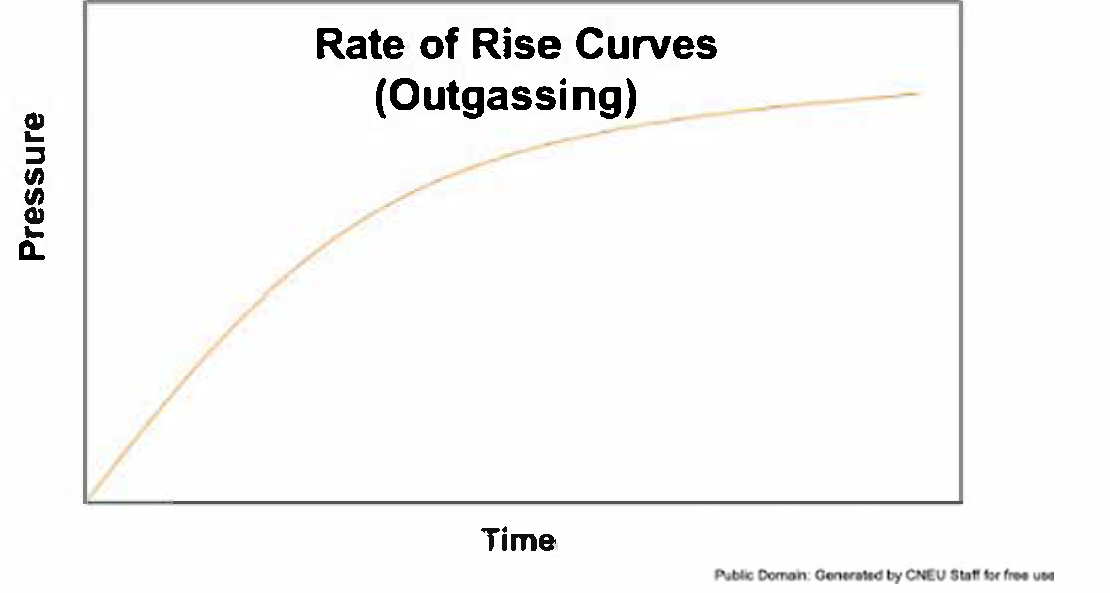
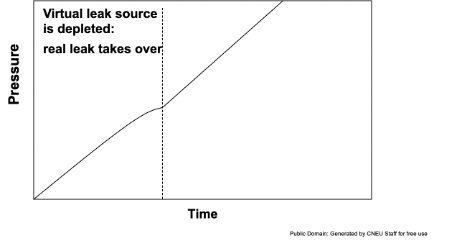
Figure 9.4 shows a possible rate-of-rise curve if a combination of real and virtual leaks is present.
Equipment and Materials
- Vacuum system consisting of: (one each)
- Process chamber
- Absolute pressure measurement device
- Gage pressure measurement device
- Vent valve
- Isolation/roughing valve
- Vacuum piping
- Rough vacuum pump
- Timing device
Procedure
Learning Activity 9.1: Taking Data
Video 9.3. Data for the rate-of-rise curve when a real leak is present in the system. Video produced by Elena Brewer and Richard Hill, SUNY Erie Community College.
Video 9.4. Data for the rate-of-rise curve when a virtual leak (or source of outgassing) is present in the system. Video produced by Elena Brewer and Richard Hill, SUNY Erie Community College.
- Record the base pressure provided by the instructor.
- Vent the chamber.
- Pump down the rough vacuum system to the base pressure. Record the pump-down time. Note: if the base pressure state cannot be attained after a reasonable pump-down time, use the lowest pressure you can achieve.
- Close the roughing valve and start the timer.
- Take pressure measurements from the absolute pressure vacuum gauge every 5-10 sec for about 2-3 minutes and record them in Table 9.1.
- Repeat steps 2 – 5 for the second rough vacuum system and record data in Table 9.2.
- Repeat steps 2 – 5 for the third rough vacuum system and record data in Table 9.3.
Learning Activity 9.2: Graphing Pressure Rate-of-Rise Curves
- Graph all three pressure rate-of-rise curves on the same graph using a linear scale.
- Clearly label all three curves.
- Based on the shape of each curve and one that achieved base pressure levels, identify which type of disturbance (if any) is present in each system.
Table 9.1. Rough Vacuum System 1
Date data recorded: _________
Base pressure: _________
Pump-down time: _________Time (seconds)
Pressure from absolute pressure measurement device
Unit of pressure
Time (seconds)
Pressure from absolute pressure measurement device
Unit of pressure
0
Observation Notes:
Was the desired base pressure reached?
Table 9.2. Rough Vacuum System 2
Date data recorded: _________
Base pressure: _________
Pump-down time: _________Time (seconds)
Pressure from absolute pressure measurement device
Unit of pressure
Time (seconds)
Pressure from absolute pressure measurement device
Unit of pressure
0
Observation Notes:
Was the desired base pressure reached?
Table 9.3. Rough Vacuum System 3
Date data recorded: _________
Base pressure: _________
Pump-down time: _________Time (seconds)
Pressure from absolute pressure measurement device
Unit of pressure
Time (seconds)
Pressure from absolute pressure measurement device
Unit of pressure
0
Observation Notes:
Was the desired base pressure reached?
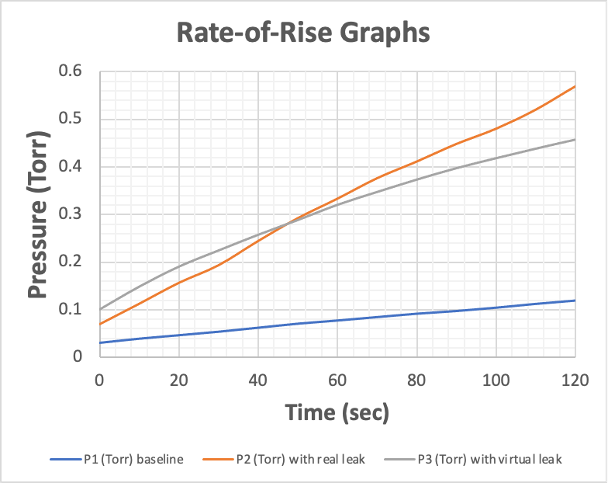
On the Rate-of-Rise Graphs from Figure 9.6, the P1 curve represents the system’s baseline rate-of-rise without leaks or an outgassing source artificially introduced into the system. The baseline pressure vs time curve rises with a very small slope. Note that every system will exhibit some baseline characteristic amount of pressure rise.
The P2 curve represents the case with real leak (piece of hair was placed between the chamber and rubber gasket). The P3 curve corresponds to the case with an outgassing source (when several drops of water were dropped on a piece of tissue placed in a beaker).
Note: Students will not know which leak is introduced during each trial. They will have to determine this based on:
- the shape of rate-of-rise curve, and
- whether or not the system base pressure was reached.
Analysis:
Based on the shape of pressure rise curves, which system did not contain any leaks? Why?
Rank the system performances based on the ability of the system to reach the desired base pressure.
Based on the shape of pressure rise curves, which system has a real leak? Why?
Based on the shape of pressure rise curves, which system has an outgassing source present? Why?

This work is supported by the National Science Foundation under grant number ATE DUE 2000454. Any opinions, findings, and conclusions or recommendations expressed in this e-book are those of the authors and do not necessarily reflect the views of the National Science Foundation.
Media Attributions
- Figure 9.1. © E. Brewer is licensed under a CC BY-NC-SA (Attribution NonCommercial ShareAlike) license
- Figure 9.2. © CNEU is licensed under a Public Domain license
- Figure 9.3. © CNEU is licensed under a Public Domain license
- Figure 9.4. © CNEU is licensed under a Public Domain license
- Figure 9.6. © E. Brewer is licensed under a CC BY-NC-SA (Attribution NonCommercial ShareAlike) license

