Learning Activities 10.1 – 10.4: Thin Film Deposition Using Rough Vacuum Equipment Trainer
Summary of Learning Activities
Learning Activity 10.1: Building Rough Vacuum Thermal Evaporator
Learning Activity 10.2: Thin Film Deposition Procedure
Learning Activity 10.3: Thin Film Characterization
Learning Activity 10.4: Controlling Deposited Thickness of the Thin Film
- Modifying a basic rough vacuum system for thin film deposition application.
- Depositing various thickness of an aluminum thin film.
- Characterizing the deposited thin film with microscope, profilometer, and/or micrometer.
- Configure the rough vacuum equipment trainer as a thermal evaporator, based on schematics.
- Practice vacuum cleanliness procedures when assembling and using the vacuum based system.
- Perform the correct sequence of operations for thin film deposition.
- Characterize the deposited thin film using a microscope, profilometer or micrometer.
Suggested Pre-lab Assignment
-
Calculate mean free path at the following chamber pressure levels:
a) 1 mTorr, b) 50 mTorr, c) 100 mTorr, d) 1 Torr, e) 760 Torr. - If the distance from the metal source to the substrate is 10 cm, what should be the maximum pressure allowing average particle to travel to the substrate without colliding with gas molecules?
Theoretical Background
The schematic of a basic rough vacuum system is shown in Figure 10.1.
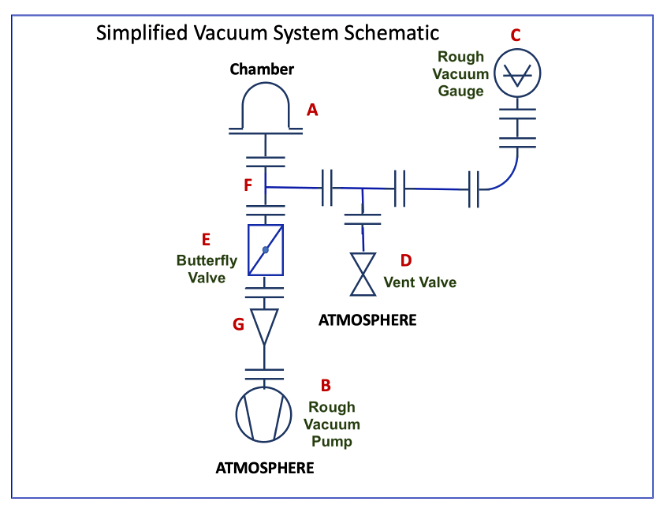
A modified schematic for the conversion of the basic rough vacuum system into a thermal evaporator is shown in Figure 10.2.
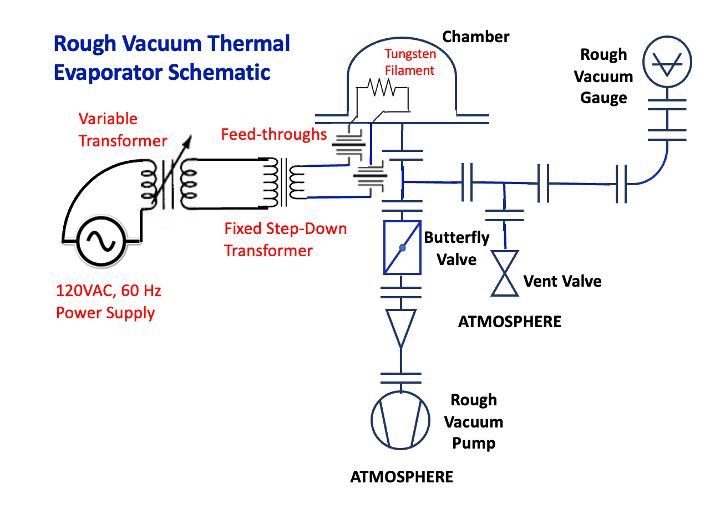
A rough vacuum system ensures that thin film deposition is done in the reduced pressure environment to allow aluminum to reach the substrate (glass slide) and to reduce contamination. Ideally, the distance between the aluminum clips (or pellets) and the substrate should be smaller than mean free path where mean free path (MFP) can be calculated using Equation 10.1:
where P is the pressure in torr.
A variable transformer (variac) is used to adjust the voltage supplied to the fixed step-down transformer. The fixed step-down transformer decreases the voltage and increases the current supplied to the feedthrough electrodes.
Using transformer 266V6B as an example, if primary side of the transformer is rated at 117 V and 126 VA, then the current supplied to the primary side at full load is only:
where Iprimary is the current in amperes, Vprimary is voltage in volts on the primary side of the transformer, and S is the source power in VA.
To heat and evaporate the aluminum, large currents on the order of 40-50A are required (smaller currents can be used if deposition is done at lower pressures). So, we need to increase the current on the secondary side.
For the ideal transformer, the amount of power transferred to the secondary side should be the same as the power on the primary side of the transformer:
If required current on the secondary side is 40A, then voltage on the secondary side should be:
The rated values for the 266V6B transformer are:
- RED-BLU: 3.15 V, 20A
- RED-YEL: 3.15 V, 20A
This means it has two secondary coils which can be connected either in series or in parallel. If the coils are connected in series, the resulting voltage and current will be 6.30V and 20A. If connected in parallel, the resulting voltage and current will be 3.15V and 40A. As 40A+ of current flows through the tungsten filament, it heats it up to the temperature sufficient to evaporate the aluminum clips placed on top of tungsten filament. Tungsten is used because its melting temperature is far above the temperature required to evaporate aluminum. However, the same amount of current will flow through the wires connecting fixed transformer to the feedthrough electrodes. Both, wires and electrodes, need to be rated for such high amount of current. For example, 8 AWG wire is required for currents between 40A and 50A. The currents on the primary side of the transformer (and the rest of the electrical circuit) are below 2A, so 16 AWG, or even 18 AWG, wires are sufficient.
Equipment and Materials
- Rough Vacuum Equipment Trainer (RVET) with a baseplate with openings for feedthroughs
- Two power feedthroughs rated at 50V and 400A
- Tungsten filament with at least 4 coils
- 1.4 KVA variable transformer (input 120V, output 0-140V)
- 126 VA step-down transformer (primary 117V, 126VA rated; secondary 3.15V, 40A rated)
- Clamp-on ammeter
- Two digital multimeters (DMMs)
- Micrometer
- Profilometer (optional)
- Microscope
- 8 AWG wires for connecting to feedthrough electrodes
- 18 AWG wires for the rest of the system
- Glass slides
- Timing device
Procedure
Learning Activity 10.1: Building Rough Vacuum Thermal Evaporator
- Connect the vacuum gauge to power. It needs 15 minutes to stabilize before accurate pressure readings can be achieved.
- Use schematics shown in Figure 10.2 to add thermal evaporator components to the existing rough vacuum system shown in Figure 10.1
- Connect primary side of the fixed transformer to the variable transformer output. Set dial on the variable transformer to 0. Keep the variable transformer powered down until the system is completely assembled.
- Connect feedthroughs to the baseplate as shown in Figure 10.3. Make sure to use gloves when performing this task to reduce contamination.
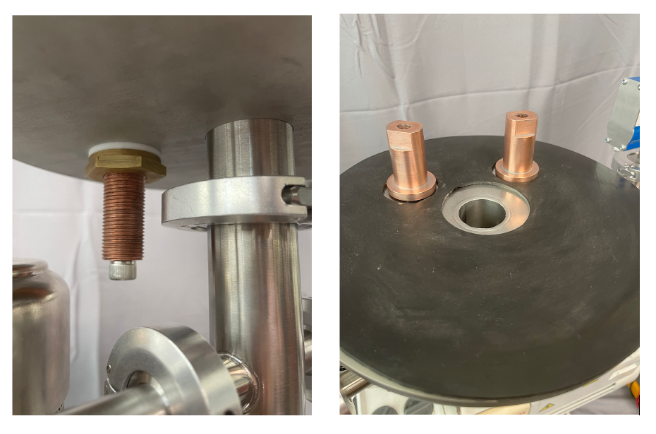
Figure 10.3. Connecting feedthroughs to the baseplate. Figure provided by E. Brewer, SUNY Erie Community College. - Connect both secondary coils of the fixed transformer in parallel and connect them to the bottom part of the feedthrough electrodes using the screws provided. Use screw terminals for the transformer wires. Make sure that 8 AWG wires are used to connect to feedthroughs.
- Connect tungsten filament to the feedthroughs as shown in Figure 10.4.
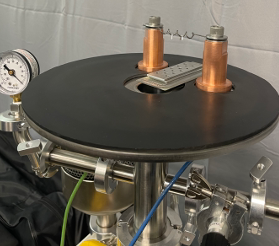
Figure 10.4. Connecting tungsten filament. Figure provided by E. Brewer, SUNY Erie Community College. - Place the clamps of the clamp-on ammeter around ONE of the wires leading to the feedthrough electrode as shown in Figure 10.5.
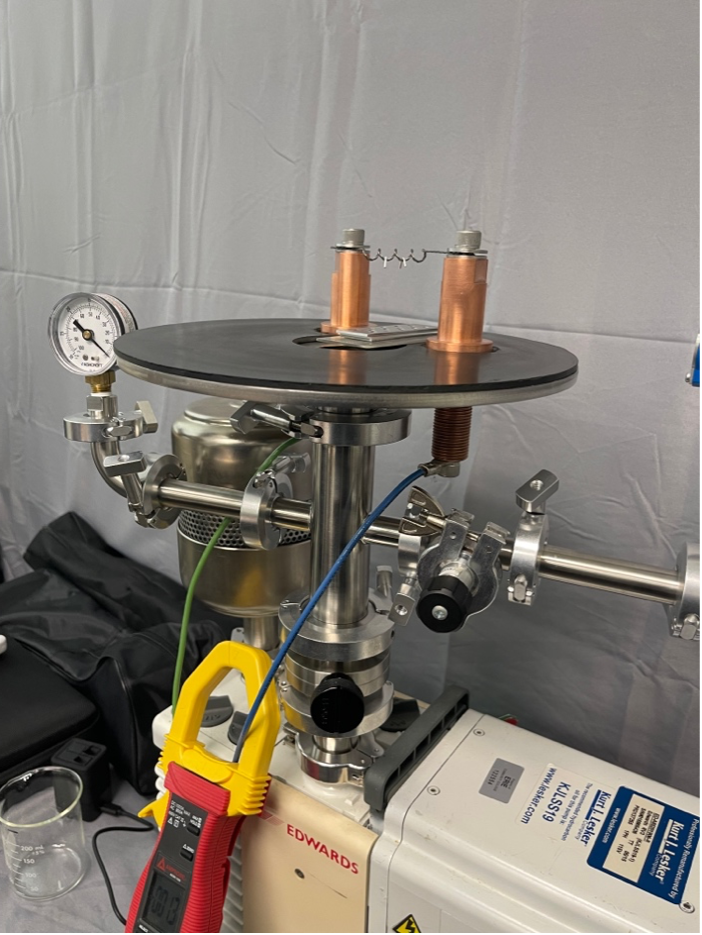
Figure 10.5. Placement of the clamp-on ammeter. Figure provided by E. Brewer, SUNY Erie Community College. - Connect DMMs to the primary and secondary sides of the fixed transformer to measure voltages Vin and Vout. Voltmeters are not shown on the circuit diagram in Figure 10.2.
- Place glass slide with the shadow mask on top as shown in Figure 10.4 directly under the tungsten filament coil.
- Place FOUR aluminum clips in the coils of the tungsten filament.
- Close chamber.
- Make sure that variac dial is set to 0 and connect it to a power source.
- Perform one or two preliminary pump-down procedures (and venting procedures) to remove outgassing sources from the chamber (such as contaminants on the feedthrough electrodes and water vapor molecules built up on the inside of the vacuum system while it was exposed to the atmosphere.
Learning Activity 10.2: Thin Film Deposition Procedure
- Pump system down to 50 mTorr using a regular pump-down procedure.
- Partially close the roughing valve so that pressure is maintained at roughly the same level. Keep the rough pump running. Note: if the roughing valve is completely closed, pressure will start rising. If roughing valve is completely open, the pressure will keep dropping unless the pressure is close to the pump’s ultimate pressure.
- Slowly adjust the dial on the variable transformer until the tungsten filament starts to glow. Record Vin_glow, Vout_glow, Iglow in Table 10.1.
- Keep adjusting the variac dial until aluminum starts evaporating. Start the timer as soon as evaporation starts.
- Keep the variac dial at the same level for 10-20 seconds or until no more material is being deposited on the wall of the chamber. One student should be responsible for recording deposition time in Table 10.1.
- Another student should record values of voltages and currents during deposition in Table 10.1: Vin_deposition, Vout_deposition, Ideposition.
- The third student should record pressure at the beginning of deposition and at the end of deposition. Then calculate and record the average pressure in Table 10.1.
- Slowly turn the variac’s dial back to 0 and turn the variac off.
- Close the roughing valve and turn the pump off.
- Slowly vent the chamber taking special care to not dislocate the glass slide.
- Wait 2-3 minutes, then open the chamber and remove the sample. It is now ready to be characterized.
Table 10.1. Deposition Data.
Date data collected: _________Trial #
1
# of aluminum clips
4
Vin_glow(V)
Vout_glow(V)
Iglow(A)
Vin_deposition(V)
Vout_deposition(V)
Ideposition(A)
P (mTorr)
T deposition (sec)
Learning Activity 10.3: Thin Film Characterization
- Label the deposited circular areas as shown in the Figure 10.6. If a different shadow mask is used, the numbering will not be the same as shown in Figure 10.6. Use these number to keep track of all consecutive measurements.
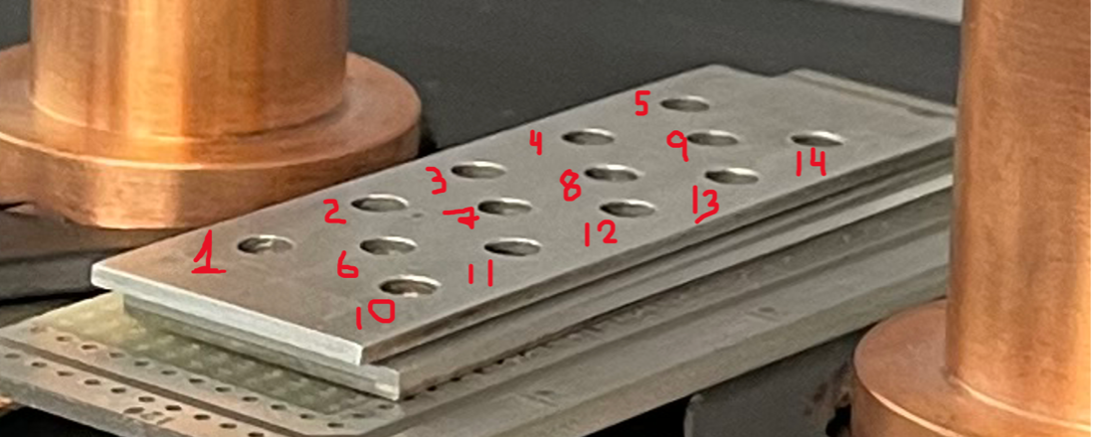
Figure 10.6. Numbering elements for the shadow mask. Figure is provided by E. Brewer, SUNY Erie Community College. - Using a miscroscope in the bright-field setting and under 5X or 10X magnification, make and save images for 3 randomly selected features, for example, Features 7, 2 and 14. It is important to characterize deposited feature with a microscope first, because a profilometer and a micrometer both make destructive measurements.
What can you say about the deposition quality based on the microscope image?
- If microscope has dark-field capability, take images of the same 3 features in the dark-field mode.
What can you say about the uniformity of the thin film based on the dark-field images?
- If the microscope has polarized light capability, take images of the same 3 features in polarized mode.
What can you say about the uniformity of the thin film based on the polarized light images?
- Using profilometer, take measurements of the thicknesses of all numbered features and record them in Table 10.2. Note: Students must undergo training for the profilometer equipment prior to completing this lab.
Table 10.2. Profilometer Measurements.
Date data collected: _________Feature #
Thin Film Thickness ( µm )
Thin Film Thickness (nm)
1
2
3
4
5
6
7
8
9
10
11
12
13
14
Data Analysis:
-
Is the thickness of the thin film uniform? If not, where was more material deposited? Where was less material deposited?
-
Based on the shape of the curve from the profilometer scans, what can you say about the smoothness of the deposited thin film?
Using micrometer, take measurements of the thicknesses of all numbered features and record them in Table 10.3.
Table 10.3. Micrometer Measurements.
Date data collected: _________
|
Feature # |
Thin Film Thickness ( µm ) |
|---|---|
|
1 |
|
|
2 |
|
|
3 |
|
|
4 |
|
|
5 |
|
|
6 |
|
|
7 |
|
|
8 |
|
|
9 |
|
|
10 |
|
|
11 |
|
|
12 |
|
|
13 |
|
|
14 |
|
Data Analysis:
-
Is the thickness of the thin film uniform? If not, where was more material deposited? Where was less material deposited?
-
Compare thickness measurements obtained with profilometer and measurements obtained with micrometer.
NOTE: You will need at least 4 clips to get meaningful measurements using micrometer. The thicknesses measured are very close to the resolution limit of the micrometer, so the precision of the micrometer measurements will be low.
-
Take an image of one of the features under microscope after micrometer measurements have been taken. Discuss what changes happened to the thin film in this feature.
Learning Activity 10.4: Controlling Deposited Thickness of the Thin Film
- Calculate average thickness of Features 7 and 8 from Table 10.2: _______________
- Divide the average thickness from the previous step by the deposition time from Table 10.1 to obtain the calculated deposition rate in micrometers per second: ________________
- Calculate the deposition time required to deposit a thin film with 2/3 of the average thickness obtained in Step 31: _________________2/3 of the average thickness: __________________
- Repeat steps from learning activity 10.1 and record data in Table 10.4. Exception: use the deposition time calculated in Step 33.
Table 10.4. Deposition Data.
Date data collected: _________Trial #
2
# of aluminum clips
4
Vin_glow(V)
Vout_glow(V)
Iglow(A)
Vin_deposition(V)
Vout_deposition(V)
Ideposition(A)
P (mTorr)
T deposition (sec)
- Using a profilometer (or microscope, if profilometer is not available), measure thickness of features 7 and 8, and record them in Table 10.5.
Table 10.5. Thickness Data.
Date data collected: _________Feature #
Thin Film Thickness ( µm )
Thin Film Thickness (nm)
7
8
Calculate average thickness: _______________________
- Compare average thickness obtained in Step 35 to the 2/3 of average thickness obtained in Step 33 by calculating % difference:______________________________
Discuss the results:
- Repeat Learning Activity 10.1 with different numbers of clips (2, 6, other) and record your data in Tables 10.6.A, 10.6.B, 10.6.C. Do measurements only for Features 7 and 8.
Table 10.6.A. Deposition Data.
Date data collected: _________Trial #
3
# of aluminum clips
Vin_glow(V)
Vout_glow(V)
Iglow(A)
Vin_deposition(V)
Vout_deposition(V)
Ideposition(A)
P (mTorr)
T deposition (sec)
Feature 7 thickness (µm)
Feature 8 thickness (µm)
Average thickness (µm)
Table 10.6.B. Deposition Data.
Date data collected: _________
|
Trial # |
4 |
|
# of aluminum clips |
|
|
Vin_glow(V) |
|
|
Vout_glow(V) |
|
|
Iglow(A) |
|
|
Vin_deposition(V) |
|
|
Vout_deposition(V) |
|
|
Ideposition(A) |
|
|
P (mTorr) |
|
|
T deposition (sec) |
|
|
Feature 7 thickness (µm) |
|
|
Feature 8 thickness (µm) |
|
|
Average thickness (µm) |
|
Table 10.6.C. Deposition Data.
Date data collected: _________
|
Trial # |
5 |
|
# of aluminum clips |
|
|
Vin_glow(V) |
|
|
Vout_glow(V) |
|
|
Iglow(A) |
|
|
Vin_deposition(V) |
|
|
Vout_deposition(V) |
|
|
Ideposition(A) |
|
|
P (mTorr) |
|
|
T deposition (sec) |
|
|
Feature 7 thickness (µm) |
|
|
Feature 8 thickness (µm) |
|
|
Average thickness (µm) |
|
Discuss the results:

This work is supported by the National Science Foundation under grant numbers ATE DUE 2000454 and ATE DUE 1700630. Any opinions, findings, and conclusions or recommendations expressed in this e-book are those of the authors and do not necessarily reflect the views of the National Science Foundation.
Media Attributions
- Figure 10.1. © E. Brewer is licensed under a CC BY-NC-SA (Attribution NonCommercial ShareAlike) license
- Figure 10.2. © E. Brewer is licensed under a CC BY-NC-SA (Attribution NonCommercial ShareAlike) license
- Figure 10.3. © E. Brewer is licensed under a CC BY-NC-SA (Attribution NonCommercial ShareAlike) license
- Figure 10.4. © E. Brewer is licensed under a CC BY-NC-SA (Attribution NonCommercial ShareAlike) license
- Figure 10.5. © E. Brewer is licensed under a CC BY-NC-SA (Attribution NonCommercial ShareAlike) license
- Figure 10.6. © E. Brewer is licensed under a CC BY-NC-SA (Attribution NonCommercial ShareAlike) license

