3 Scientific Research for the Non-Science Student: A Collaborative Observational Research Journey for a Concentrated Course or Stand-Alone Unit
Amanda Lohiser, PhD
Chapter Learning Objectives:
- To contextualize the scientific process as useful to non-science students as an avenue for critical and creative thinking.
- To explain in detail the guided observational research project process using one accelerated course as an example.
- To explore the application avenues for this project in other courses, fields of study, and teaching modalities.
Chapter Overview
How does one teach scientific research in an experiential way to students with no previous experience with or knowledge of the scientific process? When teaching undergraduate research methods-based courses that culminated with a research paper assessment, I noticed that students expressed trepidation at the scope of the assignment, with many indicating that they had not done anything like this before; in fact, many students had not yet experienced reading scholarly journal articles, writing citations in the proper format, or knowing when, how, and why to cite academic sources.
My answer to these questions in previous years was a great deal of one-on-one attention to individual students as these questions became apparent. My answer now is the assessment detailed in this chapter—an instructor-assisted document that guides students through the research process. The guide, titled Research Projects for Beginners: A Guided Journey, helps establish the answers to many “beginner” questions, enabling instructor-to-student dialogue to be more focused on developing ideas rather than directly teaching academic writing style and the basics of scientific research steps. Thus, the instructor-assisted guide document, explored in this chapter, facilitates the learner-content interaction in the form of a didactic text that encourages students through the process of designing and executing a research study. Additionally, the interactive instructor-led workshops provide ample learner-instructor interaction by providing motivation, organization, and counsel to the students through this process (Moore, 1989).
In this chapter, I examine the relevance of teaching the scientific process to non-science students and use the course Advanced Nonverbal Communication, taught in the Aarhus Summer University Program, as a case study. This chapter details the process of making the scientific process accessible to non-science students, fostering collaborative thinking through open educational resources (OER), and accomplishing these goals in a limited time frame. The assignment is described, and connections between the steps of the assignment and Bloom’s taxonomy for learning are provided. The outcomes of the assignment are described, and the assessment is appraised for its applicability to other courses, fields, and modalities.
Focused Questions:
- How might you apply this assignment to your course learning objectives and outcomes?
- How can you apply observational research to your course?
- Could you use this guide to adopt a different research methodology in your course, such as a survey, an interview series, or a content analysis?
Rationale
The undergraduate students in this chapter’s international summer university course were from institutions throughout Europe, Asia, and North America. They were enrolled in academic programs, including adult education and personnel management, business administration and commercial law, civil engineering, finance, global management and manufacturing, and occupational therapy.
Some of these fields (e.g., occupational therapy) contain explicit instruction in scientific thinking. Others in this list do not have such a direct focus on scientific research methods, but the benefits of studying scientific thinking within these curricula are still acknowledged. For instance, while financial models can be produced by computer software, finance professors promote the teaching of the scientific method in order to adapt and interpret those models (Kane, 2004). The supply of readily available consumer data to large businesses has prompted an increased call within business schools to teach the scientific method, experimentation, and skills in synthesizing research findings from scholarly work.
Teaching Scientific Thinking Across Disciplines
In an article in Scientific American, Peter Salovey (2018), president of Yale University stated, “Knowledge is power but only if individuals are able to analyze and compare information against their personal beliefs, are willing to champion data-driven decision making over ideology, and have access to a wealth of research findings to inform policy discussions and decisions” (p. 11), highlighting the importance of fostering students’ abilities as critical and creative thinkers who can make informed, evidence-driven decisions. Let us examine first what scientific methodology is and how it is connected to critical and creative thinking.
Scientific methodology is recognized as a collective standard of principles and processes that produce knowledge of the world by way of curiosity, critical thinking, empirical observations, and interpretation of those observations in a way that protects against cognitive bias (Gauch, 2003). Although wording and the number of stages may vary, the scientific process generally includes stages of asking a question, conducting research, forming and testing hypotheses, analyzing conclusions, and sharing findings.
Critical thinking speaks to the ability to assess statements (Ennis, 1964), engage in learning new material, problem-solving, and decision-making (Sternberg, 1986), and the capacity to recognize connections between statements (Mulnix, 2013). In a statement presented to the 8th Annual International Conference on Critical Thinking and Education Reform, Scriven and Paul (1987) defined critical thinking more thoroughly as “…the intellectually disciplined process of actively and skillfully conceptualizing, applying, analyzing, synthesizing, and/or evaluating information gathered from, or generated by, observation, experience, reflection, reasoning, or communication, as a guide to belief and action” (para. 3). Ultimately, critical thinking is an intentional, methodological process that fosters informed decision-making based on evidence rather than conjecture.
Scientific thinking is critical thinking. Every stage of the scientific process requires the researcher to think critically. To ask questions is to reflect on the world. Conducting research requires analyzing, synthesizing, and evaluating information. To develop a hypothesis entails drawing connections, and to test it requires problem-solving and observation. Analyzing and reporting the results necessitates evaluative assessment of the new information.
Despite the term creative thinking appearing in print over a decade before critical thinking, according to Google’s N-Gram viewer, critical thinking quickly overtook creative thinking by the 1940s. This trend, which persisted into the 1990s, reflects a broader emphasis on teaching critical thinking skills over creative thinking skills (Puccio & Lohiser, 2020; Runco, 2007). But, creative thinking also has strong ties to the scientific process—creative thinking is applying one’s imagination to make connections, envision and generate ideas, and bring them into being (Nielsen & Thurber, 2016; Osborn, 1979). At its root, creative thinking is a process—the result of dissonance in the mind between what is and what could be, which prompts the generation of something novel and useful (Stein, 1953). The Creative Problem Solving process (CPS) originated by Osborn and Parnes echoes scientific thinking with its four stages: (1) Clarify the problem, (2) Ideate potential ways for solving it, (3) Develop a workable solution, and (4) Implement that solution as an action plan. Within each of these stages, divergent thinking and convergent thinking occur. Divergence focuses on producing as much information or options as possible and convergence focuses on sifting through those choices for that which is most relevant and useful (Miller et al., 2011; Puccio et al., 2012).
Therefore, scientific thinking is also creative thinking. Inherent curiosity gives rise to asking questions and seeking their answers. Students who engage in scientific thinking are engaging in creative problem solving, with divergent and convergent thinking evident along the way. Stein (1953), in fact, speaks directly to creative thinking entailing the development and testing of hypotheses, as well as the need to communicate the novel output to others. The CPS is a process for developing new and workable solutions to problems based on evidence and observation (Puccio et al., 2012). It is reflected in the stages of conducting research, forming and testing hypotheses, analyzing conclusions, and sharing findings.
There is a place for scientific thinking across all academic disciplines, and the following project provides students from any educational background a taste of this process in a way that makes it fun, accessible, and rewarding.
Assessment Description
The assessment described in this chapter combines student-developed materials with an instructor-led narrative and is designed to be used in a concentrated 2-3 week period. It could also serve as a stand-alone unit or course. The assessment consists of a guide entitled Research Projects for Beginners: A Guided Journey and is intended to be used in a synchronous or asynchronous setting. This guide walks students through the scientific process in an easy-to-follow way, with each of the six stages of the scientific process broken down into steps that fall within the higher-order learning levels of Bloom’s Taxonomy, with corresponding tasks within each step. All of these tasks ultimately coalesce into a research paper, completed in three parts—Research Question and Hypotheses (paper 1), Method and Rationale (paper 2), and Findings and Discussion (paper 3). Within the guide are three points at which students generate OER content. I created this assessment for Advanced Nonverbal Communication, taught in this case as a 3-week undergraduate course.
Advanced Nonverbal Communication is an undergraduate course constructed around the objectives of fostering an understanding of the evolutionary roots of nonverbal behavior and the effects of environment, territory, personal space, physical characteristics, gesture, posture, touch, facial expressions, eye behavior, and vocalics on human communication. The course topics are explored through a cross-cultural lens and from the perspective of applicability in a professional environment. Students learn to better interpret the nonverbal cues in the world around them and become more aware of the nonverbal messages they send. I teach the course for three weeks as part of the International Summer University program at Aarhus University, which started in 2010 with the vision to provide Aarhus students with the opportunity to gain international experiences at home while advancing their degrees, promote Aarhus University to international students through studying there for the summer, and foster internationalization through the offering of courses by international lecturers to a diverse student audience (T. F. Mortensen, personal communication, September 16, 2024).
To best meet the learning objectives of this course, with consideration of both the timeframe and diverse student backgrounds, I guide students through the scientific process, enabling them to conduct their own observational research by way of web cameras found on the website Earthcam.com and present those findings orally and in a final paper.
Making Scientific Thinking Accessible to Non-Science Students
Having established why scientific thinking benefits non-science students, the pedagogical challenge becomes making the scientific process accessible to them and preventing students from a variety of academic backgrounds from feeling daunted by the steps of an unfamiliar process in a concentrated timeline. The solution to this challenge was to take the “big thing” and turn it into multiple smaller things, presented in an easy-to-follow linear structure. Task-by-task, students encountered and executed the stages of research in scaffolded steps that tapped into their innate curiosity and the benefits of peer-to-peer learning. I structured the guide by combining the rigor of the scientific method with elements of creative problem-solving, presented in a narrative way.
The instructor-led guide is an OER published under a CC-BY license (see Appendix A). Table 1 provides an overview of the guide, the tasks within it, the corresponding stages of the scientific process, the levels of Bloom’s taxonomy that each falls into, and the outcome produced in each step. Figure 1 shows a screenshot of the guide and the organizational outline or “document tabs” that enable easy navigation of this pageless document.
The guide breaks the scientific process into six stages and presents three OER documents constructed by the students for the collective benefit of their current peers and students in future offerings of the class. The benefits of OER are seen as a learner-to-learner interaction in that students benefit from the knowledge and guidance of their own peers (Moore, 1989).
Correlation of Steps to Bloom’s Taxonomy
Each of the steps in the guide were crafted to fit within the higher orders of thinking within Bloom’s revised taxonomy as described in Krathwohl (2002). For example, “developing a good query” fits within the Create cognitive process dimension of Bloom’s revised taxonomy, as students might choose to generate their own original question at this stage. It also fits within the Applying dimension, as students may take a previously existing question and adapt it to their own interests. The overview of the guide in Table 1 shows where each of these steps fall within Bloom’s revised taxonomy, demonstrating the higher orders of thinking that this research project promotes.
The guide walks students through all six steps of the scientific process, which are broken down into one or more steps, each containing one or more tasks. Along the way, the tasks help students write three portfolio assignments that ultimately form the building blocks of an entire research paper. The first portfolio assignment within the guide is an “Annotated Bibliography.” This assignment incorporates Stages 1-3 in the scientific process: Ask a question, Do background research, and Develop a hypothesis, and students complete nine tasks that lead them up to this paper. The second portfolio assignment within the guide is a “Methods and Rationale” paper. It incorporates Stage 4 in the scientific process: Test your hypothesis, and students complete six tasks in preparation for writing this paper. The third and final portfolio assignment within the guide is a “Findings and Conclusions” paper. It incorporates Stages 5-6 in the scientific process: Analyze data and Report your findings, and incorporates a total of six tasks. The following section details each element of this guide document:
- The STAGES of the scientific process, which are clarified as one or more STEPS
- The interactive TASK(S) within each step that students complete within the guided worksheet document
- The OER components that students develop together
- The portfolio assignment papers that students write, which eventually become the pieces of their final research paper.
For a detailed visual overview of this guide’s design, see Table 1.
| Scientific thinking stage | Steps within the guide for this stage | Where step fits in Bloom’s taxonomy | Description of tasks related to the step within the guide | OER component within this step | Culmination portfolio paper: |
| 1. Ask a question | Developing a good query | Applying; Create | 1. Students select a question
2. Write their question |
Collaboration: Research Findings from previous years | Portfolio Paper #1: Research question, annotated bibliography, hypotheses |
| 2. Do background research | Identifying constructs and variables | Analyze | 3. List constructs | ||
| Finding scholarly research | Analyze | 4. List search strings | Collaboration: Useful articles | ||
| Analyzing sources | Analyze; Create | 5. Create annotations | |||
| 3. Develop a hypothesis | Creating a hypothesis | Create | 6. Indicate the independent and dependent variables
7. Write the hypothesis 8. Write the null hypothesis 9. Draw on Tasks 1-8 to write Portfolio #1 |
||
| 4. Test your hypothesis | Selecting your observational research setting | Evaluate | 1. Re-write hypotheses
2. Record information about selected cameras |
Collaboration: Interesting cameras | Portfolio Paper #2: Methods, Rationale |
| Designing your data collection system | Create | 3. Create data collection table | |||
| Setting your observation times and duration | Create | 4. Answer questions about data collection times | |||
| Collecting your data | Create | 5. Record data
6. Draw on Tasks 1-5 to write Portfolio #2 |
|||
| 5. Analyze and draw a conclusion | Explaining what you observed | Analyze | 1. Answer questions about patterns in observations
2. Summarize findings |
Portfolio Paper #3: Findings, Discussion | |
| Interpreting what you observed | Evaluate | 3. Connect findings to annotated bib
4. Review hypotheses 5. Consider limitations 6. Consider usefulness of study 7. Draw on Tasks 1-6 to write Portfolio #3 |
|||
| 6. Report your results | Communicating your findings in class | Create | Unnumbered but described: Present in class | ||
| Sharing your findings with future students | Create | Unnumbered but described: Contribute to 3rd OER database | Collaboration: Research findings |
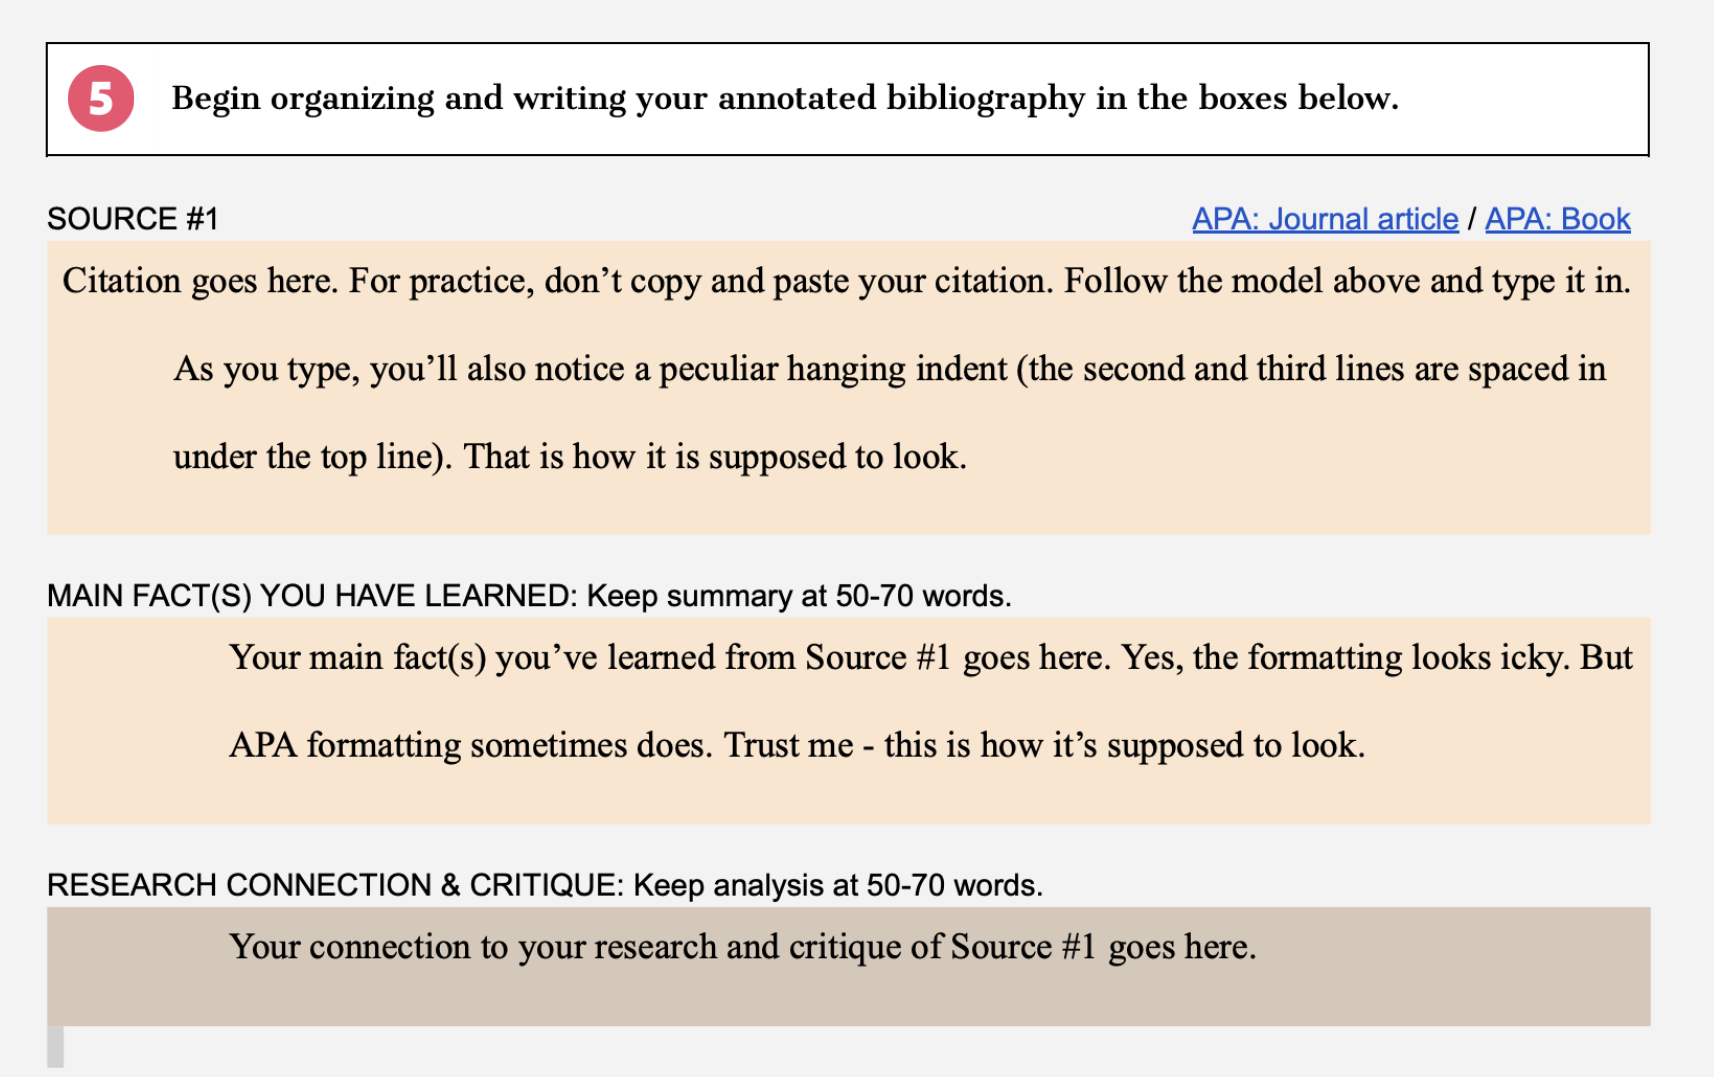
The guide starts by explaining the document’s layout, showing how the scientific process is depicted as a flowchart. Colored boxes represent the different stages in the scientific process, illustrated in Figure 2.

Students are guided through the scientific process using a color-coded system. The process stages are associated with specific headings; the tasks they need to complete are highlighted in white boxes with red numbers. Specifically, students are introduced to how the stages of the scientific process correspond to color-coded headings that will walk them through a series of tasks and how to recognize the tasks in their white offset boxes with red numbers (see Figure 1). Then, students complete three portfolio assignments at key points during the process. Additionally, they are introduced to the “collaborate” directive, which appears in dark gray boxes, indicating moments when they will work together to create an OER component.
Stage 1: Ask a Question
The guide begins with Stage 1 of the scientific process: Ask a question. This stage is consolidated into one step: “Developing a good query.” After a brief introduction to relay the connection between the scientific process and human curiosity, students are presented with a series of twelve questions. Task 1 in this step instructs students to choose one question that interests them the most. Task 2 invites them to adapt the question to their interests. This promotes individuality, freedom of thought, and the spirit of inquiry. However, pre-crafted questions may be useful for the student who is new to this process and may not know where to begin. They may end up adapting the question to better suit their interests and findings within the research as they progress through the tasks.
During Stage 1, students can also access the OER document they will encounter at the end of the research project. This document asks them to compile a short summary that includes their research question, hypotheses, methods, and findings. Students may use a question they find there as a springboard for their research. Details from previous students’ assignments are rich enough to provide inspiration and cumulative knowledge-building without being overwhelming while also ensuring academic rigor by preventing them from entirely replicating another student’s research methods.
Stage 2: Do Background Research
Next, students begin Stage 2: Do background research. Stage 2 contains three steps: “Identifying constructs and variables,” “Finding scholarly research,” and “Analyzing sources.” The step “Identifying constructs and variables” contains Task 3, which encourages divergent thinking by listing as many words related to their research question that they may wish to research further. The goal is to enable students to think of synonyms for the constructs in their question, which will aid in locating research articles and, later, identifying variables to formulate their hypotheses.
The step “Finding scholarly research” begins with an introduction to Google Scholar and a library’s periodical databases. The guide demonstrates to students how to type in a search string and access the search results as open-access PDFs or hyperlinks connected through a library database. Task 4 in this step asks students to create search strings related to their question and test them in Google Scholar or their library’s search page. Students are helped to understand that they may not find articles that speak to their topic specifically, but they may find ones that will inform them by building a constellation of perspectives on the topic.
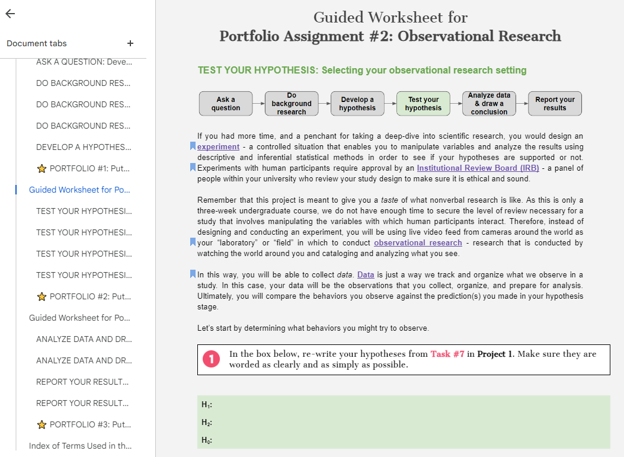
Next, the “Finding scholarly research” step includes the first student-developed OER component, where students contribute key sources they have found to a Google Sheet that lists the year, authors, title, hyperlink, type of source, and key topics. This creates a compendium of screened sources relevant to their project and potentially to the projects of their peers. Figure 3 shows a screenshot demonstrating how students (names redacted) have populated the sheet.
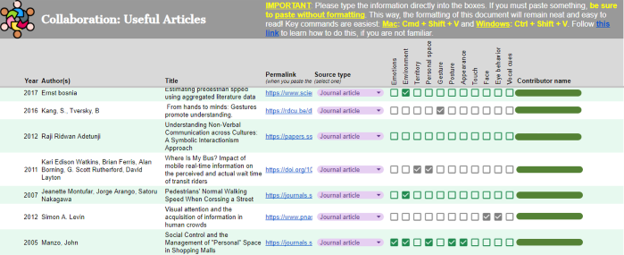
The final step in this stage, “Analyzing sources,” helps students begin to compile the elements of an annotated bibliography as a method for reviewing and analyzing sources. While a literature review offers a deeper synthesis of themes across sources, past experiences show that an annotated bibliography proved to be a more approachable way for students new to academic research. This step explains annotated bibliographies and citations with color-coded examples, hyperlinked sources, and examples of annotated paragraphs. Task 5 within this step provides color-coded boxes (see Figure 4) with explanatory text that enables students to begin writing their annotated bibliographies, consisting of a citation, a summative paragraph, and a research connection and critique paragraph.
Stage 3: Develop a Hypothesis
Stage 3 is also consolidated into one step: “Creating a hypothesis.” Students are given definitions and examples of independent and dependent variables. Now that they are more informed on their topics through a review of the literature, students isolate one key independent and dependent variable in Task 6. While they could identify multiple variables, they are encouraged to keep their inquiry limited to focus on just one of each.
With DV and IV prepared, students now construct a hypothesis (H1) and a null hypothesis (H0) in Tasks 7 and 8. When applicable, students are asked to generate the opposite wording of their hypothesis to serve as a second hypothesis (e.g., H1: In a more crowded environment, strangers acknowledge each other less frequently, and H2: In a less crowded environment, strangers acknowledge each other more frequently). Although this action may seem superfluous, I have found that requiring students to analyze their observational framework that identifies two different variations of the same factors encourages more detailed observation that helps prevent confirmation bias.
First Portfolio Assignment: Ask a Question, Do Background Research, Develop a Hypothesis
The guide now presents students with directions for the first portfolio assignment (Task 9), which systematically explains how to compile each Task from the stages above into a paper. Students’ research questions developed in Tasks 1 and 2 in Stage 1 (Ask a question) are incorporated into a paragraph in which the research question is appropriately introduced. The citations for the sources they found and the accompanying annotative paragraphs from Tasks 3-5 in Stage 2 (Do background research) become the annotated bibliography. Finally, the hypotheses they developed through Tasks 6-8 in Stage 3 (Develop a hypothesis) become a closing paragraph, which draws clear connections between how students progressed from research question to hypotheses and introduces the hypotheses in appropriate detail. After the directions for the first portfolio assignment, the guide instructs students to stop at that point.
Stage 4: Test Your Hypothesis
The next part of the guide introduces Stage 4 of the scientific process: Test your hypothesis. This stage is split into four steps: “Selecting your observational research setting,” “Designing your data collection system,” “Setting your observation times and duration,” and “Collecting your data.” There are a total of six Tasks across these steps.
The website EarthCam is the primary source of cameras for this assignment series, although students generated options from other websites, as well. EarthCam is an atlas of sorts of live streaming (and archived footage from) web cameras around the world. Some cameras provide a distance-perspective of people’s behavior (e.g., Moscow Skyline Cam, 2024), and others provide a closer view, like a city sidewalk (e.g., Times Square Street Cam, 2024) or a close-up view of people dining in a café (e.g., Miami News Cafe, 2024). These cameras are usually found in areas of prevalent tourism and allow people to explore the world, fostering a sense of connection and community (EarthCam, 2024). Before being introduced to EarthCam, students rewrite their hypotheses in Task 1. Then, EarthCam is introduced to students. In Task 2, students explore the site and begin compiling information about cameras that might provide them with a viable field for conducting observations to help them explore their hypotheses.
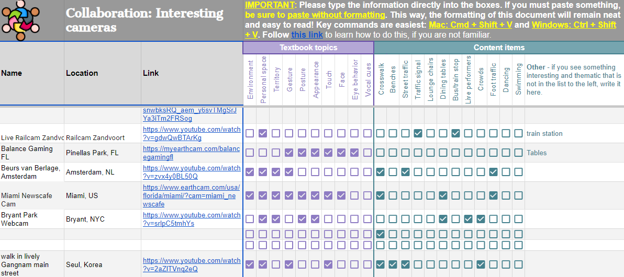
After Task 2, students encounter the second OER component. Students access an editable Google Sheet where they share interesting cameras they have found. The checkboxes within the sheet indicate what elements are visible in the cameras (e.g., crosswalks, benches, foot traffic) and what textbook topics the camera may pertain to (e.g., personal space, gesture, face). In this way, students construct a database of useful cameras for their peers and future students in the class to use as a resource. A screenshot is shown in Figure 5, demonstrating how students (names redacted) have populated the sheet.
The next steps in Stage 4 are “Designing your data collection system” and “Setting your observation times and duration.” These steps emphasize the importance of building a sound methodology that prevents confirmation bias. Students create a table to record their data in Task 3 and identify the time of day and duration of their observations in Task 4.
The final step in this stage is “Collecting your data.” In Task 5, students implement their plan by conducting their observations in and out of class time and keeping detailed, organized records of what they see. Students are encouraged to conduct enough observations until they begin to see patterns emerge and can recognize the frequency and consistency of events.
Second Portfolio Assignment: Methods and Rationale for Testing Your Hypothesis
The second portfolio assignment is a methods paper. The directions show students how Task 1, in which they rewrote their hypotheses, becomes an introduction. Tasks 2-4 enable them to describe in detail the way they set out to collect observations. Students name the cameras and describe the vantage point afforded, the time and duration of their observations, and how they recorded their data. The second section of the paper is their rationale, where students draw connections between their methodology and those they read about during their review of the literature.
Stage 5: Analyze Data and Draw Conclusions
Stage 5 is Analyze and draw conclusions, which contains two steps: “Explaining what you observed” and “Interpreting what you observed”.
Task 1 in “Explaining what you observed” guides students through questions to answer based on their table of collected data, including “What patterns emerged across your observations?” and “Did you see anything that surprised you?”. Then, they are shown how to synthesize their findings, demonstrating the difference between a “data dump” and a well organized data display. Finally, students summarize their findings into up to five key points of interest in Task 2.
The second step in this stage is “Interpreting what you observed.” In this step, great care is taken to ensure students understand that their data are not generalizable to a larger population. Instead, the data are descriptive rather than inferential, and students must express their findings accordingly. This step helps students analyze patterns identified earlier through comparison and contrasts with their literature review, driven by their original thinking rather than numerical analysis. Therefore, Task 3 requires students to explicitly list their findings and compare or contrast them to a finding in a source they reviewed. In Task 4, they list their hypotheses and indicate whether they were supported (fully or partially). Study limitations are explained, and they compile a list of limitations in Task 5. Finally, they indicate what makes their study useful, interesting, important, or relevant in Task 6.
Stage 6: Report Your Results
Stage 6, Report your results, contains two steps: “Communicating your findings in class” and “Sharing your findings with future students.”
First, “Communicating your findings in class” includes a brief presentation in which students state their hypotheses, highlight the essence of their methods, and present their most interesting findings. The comparison of this class event to a research conference is played up only to the level at which it affects a fun, convivial atmosphere rather than to place upon it the pressure of an oral exam. This class event could lend itself well to an event within a preexisting campus community research forum.
The final step, “Sharing your findings with future students,” constitutes the third and final OER component. Students enter a summarized version of their research question, hypotheses, methods, and primary findings on a Google Sheet, knowing that future students may refer to it during Stage 1, Ask a question. Students are encouraged, but not required, to leave their contact information should students wish to reach out to them.
Third Portfolio Assignment: Analyze Data, Draw Conclusions, and Report Your Results
The final portfolio assignment is a Conclusions paper. The guide directions show how Tasks 1 and 2 become a “Findings” section, in which students describe what they saw objectively, in narrative and table form. Tasks 3-6 become a “Discussion” section in which students interpret their findings based on the literature and assess the limitations and usefulness of their study.
Debrief
By way of a template that simply guides students through the result of stitching the three portfolio projects together, students submit a research paper at the end of the three weeks of guided instruction. A key element of the 2024 course was the introduction of new open educational resources (OER) materials, which included a compilation of research sources and EarthCam hyperlinks. Feedback from students’ final papers indicates that these resources were useful in supporting their research. Many students incorporated multiple cameras and sources into their work, demonstrating that the resources provided a valuable foundation. However, it is notable that the integration of these materials was not so extensive that students relied entirely on the work of their peers, suggesting a balanced use of the resources.
Next summer, I will incorporate the third OER component—the database of student research questions, method summary, and key findings—into the Ask a question stage of the research project, as described above. This will allow the work of the 2024 cohort to directly benefit the 2025 cohort by providing a structured resource for their research inquiries. By incorporating this student-generated content into the learning process, the course will support current students and foster a sense of collaboration and continuity between classes. This evolution of the OER materials aims to enhance the collaborative and cumulative nature of the research project, further enriching the student experience.
Appraisal
A student exit survey yielded supportive comments about the efficacy of the guide in teaching the research process to non-science students. One student wrote:
The guided worksheet was immensely helpful in helping me write my first research paper without feeling intimidated by it. Breaking it down into bite-sized sections helped to organize thoughts and even left me surprised at how long the paper was by the end after only doing small parts at a time.
This feedback highlights the value of breaking complex tasks into manageable steps, which helped reduce anxiety and encouraged steady progress. The student’s surprise at the length of the final paper reflects the guide’s effectiveness in facilitating incremental progress, ultimately empowering students to complete a full research paper with confidence.
This project could serve as a stand-alone module within a larger course or could be similarly integrated into a shorter class term like this one. The project itself could reasonably be executed within a one-week “workshop” time frame consisting of five 3-hour instructional/guided workshop periods followed by student work periods outside of class or built within the workshop. The goal of offering the overview of this assignment series is to demonstrate its value both for its applicability as a stand-alone accelerated course or as a stand-alone module that could be implemented within other courses for which the scientific method or the concept of observational research might be appropriate.
The guided project series described in this chapter can be adapted to various research methods in other disciplines, especially if given the time to procure IRB approval from the home university. For example, the process could be applied to creating a survey, conducting interviews or focus groups, content analyses, or even executing a simple lab experiment.
Results from the student survey also suggested that the OER components were valuable, with 18 of the 22 students surveyed reporting them to be “useful” or “very useful,” with “useful” being defined as enhancing their comprehension of the topic of nonverbal communication. In addition, nearly 50 unique peer review sources were compiled into the first OER document, “Collaboration: Useful Articles,” and seven alternative cameras were added to the second OER document, “Collaboration: Interesting Cameras.” The final OER document, “Collaboration: Research Findings,” in which students contributed a summary of their research, was less populated, with five students detailing their studies and four including their contact information for future students to contact them. Two observations are worth noting: (1) Greater OER document completion might be attainable by attaching a small incentive, and (2) The OER document served as a springboard for wider, less-documented student collaboration.
Years of teaching research methods and overseeing numerous student projects have shown me that a successful, simple analysis of a small amount of data does more for a beginner student’s self-assuredness than trying to manage and interpret a large amount of data with complex analyses. Cooking classes do not begin with the hardest recipes for a reason. Using this analogy, some students in this class eventually tackle complex projects—the bœuf bourguignon—but even the most experienced chef begins with a basic omelet. This project strives to yield successful, confidence-building “omelets” through simple observational studies, ensuring students understand the basics of the scientific process supported by their peers.
References
EarthCam. (2024). About EarthCam. https://www.earthcam.com/company/aboutus.php
Ennis, R. H. (1964). A definition of critical thinking. The Reading Teacher, 17(8), 599-612. https://www.jstor.org/stable/20197828
Gauch, H. G. (2003). Scientific method in practice. Cambridge University Press.
Kane, S. (2004). Scientific methods in finance. International Review of Financial Analysis, 13(2004), 105-118. https://doi.org/10.1016/j.irfa.2004.01.003
Krathwohl, D. R. (2002). A revision of Bloom’s Taxonomy: An overview. Theory into Practice, 41(4), 212-218. https://doi.org/10.1207/s15430421tip4104_2
Miami News Cafe. (2024). Enjoy the sights of Miami! https://www.earthcam.com/usa/florida/miami/?cam=miami_newscafe
Miller, B., Vehar, J., Firestien, R., Thurber, S., & Nielsen, D. (2011). Creativity unbound: An Introduction to creative process. FourSight LLC.
Moore, M. G. (1989). Editorial: Three types of interaction. American Journal of Distance Education, 3(2), 1-6. https://doi.org/10.3200/CTCH.56.4.219-224
Moscow Today. (2024). Live from Moscow! https://www.earthcam.com/world/russia/moscow/?cam=moscow_hd
Mulnix, J. W. (2013). Thinking critically about critical thinking. Educational Philosophy and Theory, 44(5), 464-479. https://doi.org/10.1111/j.1469-5812.2010.00673.x
Nielsen, D., & Thurber, S. (2016). The secret of the highly creative thinker: How to make connections others don’t. BIS Publishers.
Osborn, A. F. (1979). Applied imagination. Charles Scribner’s Sons.
Puccio, G. J., & Lohiser, A. (2020). The case for creativity in higher education: Preparing students for life and work in the 21st century. Kindai Management Review/The Institute for Creative Management and Innovation, Kinki University, 8, 30-47.
Puccio, G. J., Mance, M., Barbero Switalski, L., & Reali, P. (2012). Creativity rising: Creative thinking and creative problem solving in the 21st century. ICSC Press.
Runco, M. A. (2007). Creativity: Theories and Themes: Research. Development and Practice. Elsevier Academic Press.
Salovey, P. (2018, June). We should teach all students, in every discipline, to think like scientists. Scientific American, 318(6), 11-12. https://www.scientificamerican.com/article/we-should-teach-all-students-in-every-discipline-to-think-like-scientists/
Scriven, M., & Paul, R. (1987). Defining critical thinking. In The Foundation for Critical Thinking. https://www.criticalthinking.org/pages/defining-critical-thinking/766
Stein, M. I. (1953). Creativity and culture. Journal of Psychology, 36, 31–322.https://doi.org/10.1080/00223980.1953.9712897
Sternberg, R. J. (1986). Critical thinking: Its nature, measurement, and improvement. National Institution of Education, 1-37. https://eric.ed.gov/?id=ED272882
Tenney, E. R., Costa, E., & Watson, R. M. (2021, June 16). Why business schools need to teach experimentation. Harvard Business Review. https://hbr.org/2021/06/why-business-schools-need-to-teach-experimentation
Times Square Street Cam. (2024). Live from NYC’s Times Square! https://www.earthcam.com/usa/newyork/timessquare/?cam=tsstreet
