
Chapter 2 Appendices
Appendix A: Rubric for Self and Peer Assessment
Scale:
- +, ! = excellent
- √ = meets expectations; good.
- ~ = Ok, could be better.
- X = needs work.
- NA = not applicable
| Art | Your assessment | Comments |
| Intent was realized | ||
| Effective | ||
| Impact | ||
| Interesting | ||
| Beautiful | ||
| Dramatic | ||
| Feel/texture | ||
| No distracting elements | ||
| Framing/cropping enhances image |
| Flow | Your assessment | Comments |
| Clearly illustrates phenomena | ||
| Flow is understandable | ||
| Physics revealed | ||
| Details visible | ||
| Flow is reproducible | ||
| Flow is controlled | ||
| Creative flow or technique | ||
| Publishable quality |
| Photographic/video technique | Your assessment | Comments |
| Exposure: highlights detailed | ||
| Exposure: shadows detailed | ||
| Full contrast range | ||
| Focus | ||
| Depth of field | ||
| Time resolved | ||
| Spatially resolved | ||
| Photoshop/ post-processing enhances intent | ||
| Photoshop/ post-processing does not decrease important information |
| Report | Characteristics | Your assessment | Comments |
| Collaborators acknowledged | |||
| Describes intent | Artistic | ||
| Scientific | |||
| Describes fluid phenomena | |||
| Estimates appropriate scales | Reynolds number etc. | ||
| Calculation of time resolution etc. | How far did flow move during exposure? | ||
| References: | Web level | ||
| Refereed journal level | |||
| Clearly written | |||
| Information is organized | |||
| Good spelling and grammar | |||
| Professional language (publishable) | |||
| Provides information needed for reproducing flow | Fluid data, flow rates | ||
| geometry | |||
| timing | |||
| Provides information needed for reproducing vis technique | Method | ||
| dilution | |||
| injection speed | |||
| settings | |||
| Lighting type | (strobe/tungsten, watts, number) | ||
| light position, distance | |||
| Provides information for reproducing image | Camera type and model | ||
| Camera-subject distance | |||
| Field of view | |||
| Focal length | |||
| aperture | |||
| shutter speed | |||
| Frame rate, playback rate | |||
| ISO setting | |||
| # pixels (width X ht) | |||
| Editing and post-processing techniques | |||
| "before" editing image is included |
Appendix B: Copyright Agreement
THIS COPYRIGHT AGREEMENT (hereinafter “Agreement”) is between Professor Jean Hertzberg (hereinafter Professor) and _________ (hereinafter “Student”).
WHEREAS, Student has or will participate in the Course “Flow Visualization” (hereinafter “Course”) at the University of Colorado, the purpose of which is to provide Student with experience applying skills and knowledge in the field of physics and art of visualizing and photographic recording of fluid flows; and
WHEREAS, the professor of this class Jean Hertzberg (hereinafter “Professor”), desire to use materials developed by the Student (hereinafter “Creative Work”) for instructional purposes or for use in Professor’s scholarly publication and outreach activities; and
WHEREAS, Student is willing to allow such use of his/her Creative Work;
NOW THEREFORE, in consideration of University granting Student permission to work on the Project, and in consideration of the mutual promises described herein, the parties hereto agree as follows:
- Use.
- Student hereby grants Professor the right to use the Creative Work, including any copyrights or other intellectual property rights that may apply to such Creative Work, solely for the following purposes:
- For Professor’s personal instructional purposes at the University of Colorado;
- For recruitment and publicity for the University of Colorado;
- For use in Professor’s non-commercial scholarly publication(s) with appropriate citation of the Creative Work accorded to the Student as described in Section 2.
- Professor hereby agrees not to use the Creative Work for any other purpose than specifically described herein without prior written permission.
- Student hereby grants Professor the right to use the Creative Work, including any copyrights or other intellectual property rights that may apply to such Creative Work, solely for the following purposes:
- Public Acknowledgment.
Professor agrees to appropriately acknowledge the Student’s Creative Work in any publication or instructional materials developed by Professor.
IN WITNESS WHEREOF the parties have executed this Agreement as of the date first below written.
Professor
- Printed Name:
- Date:
- Signature:
Student
- Printed Name:
- Date:
- Signature:
Appendix C: Student Work Example
“Get Wet Report”
Flow Visualization by Janelle Montoya, Sept. 25, 2015
Note: This appendix is formatted according to the student’s assignment requirements.
1 Purpose
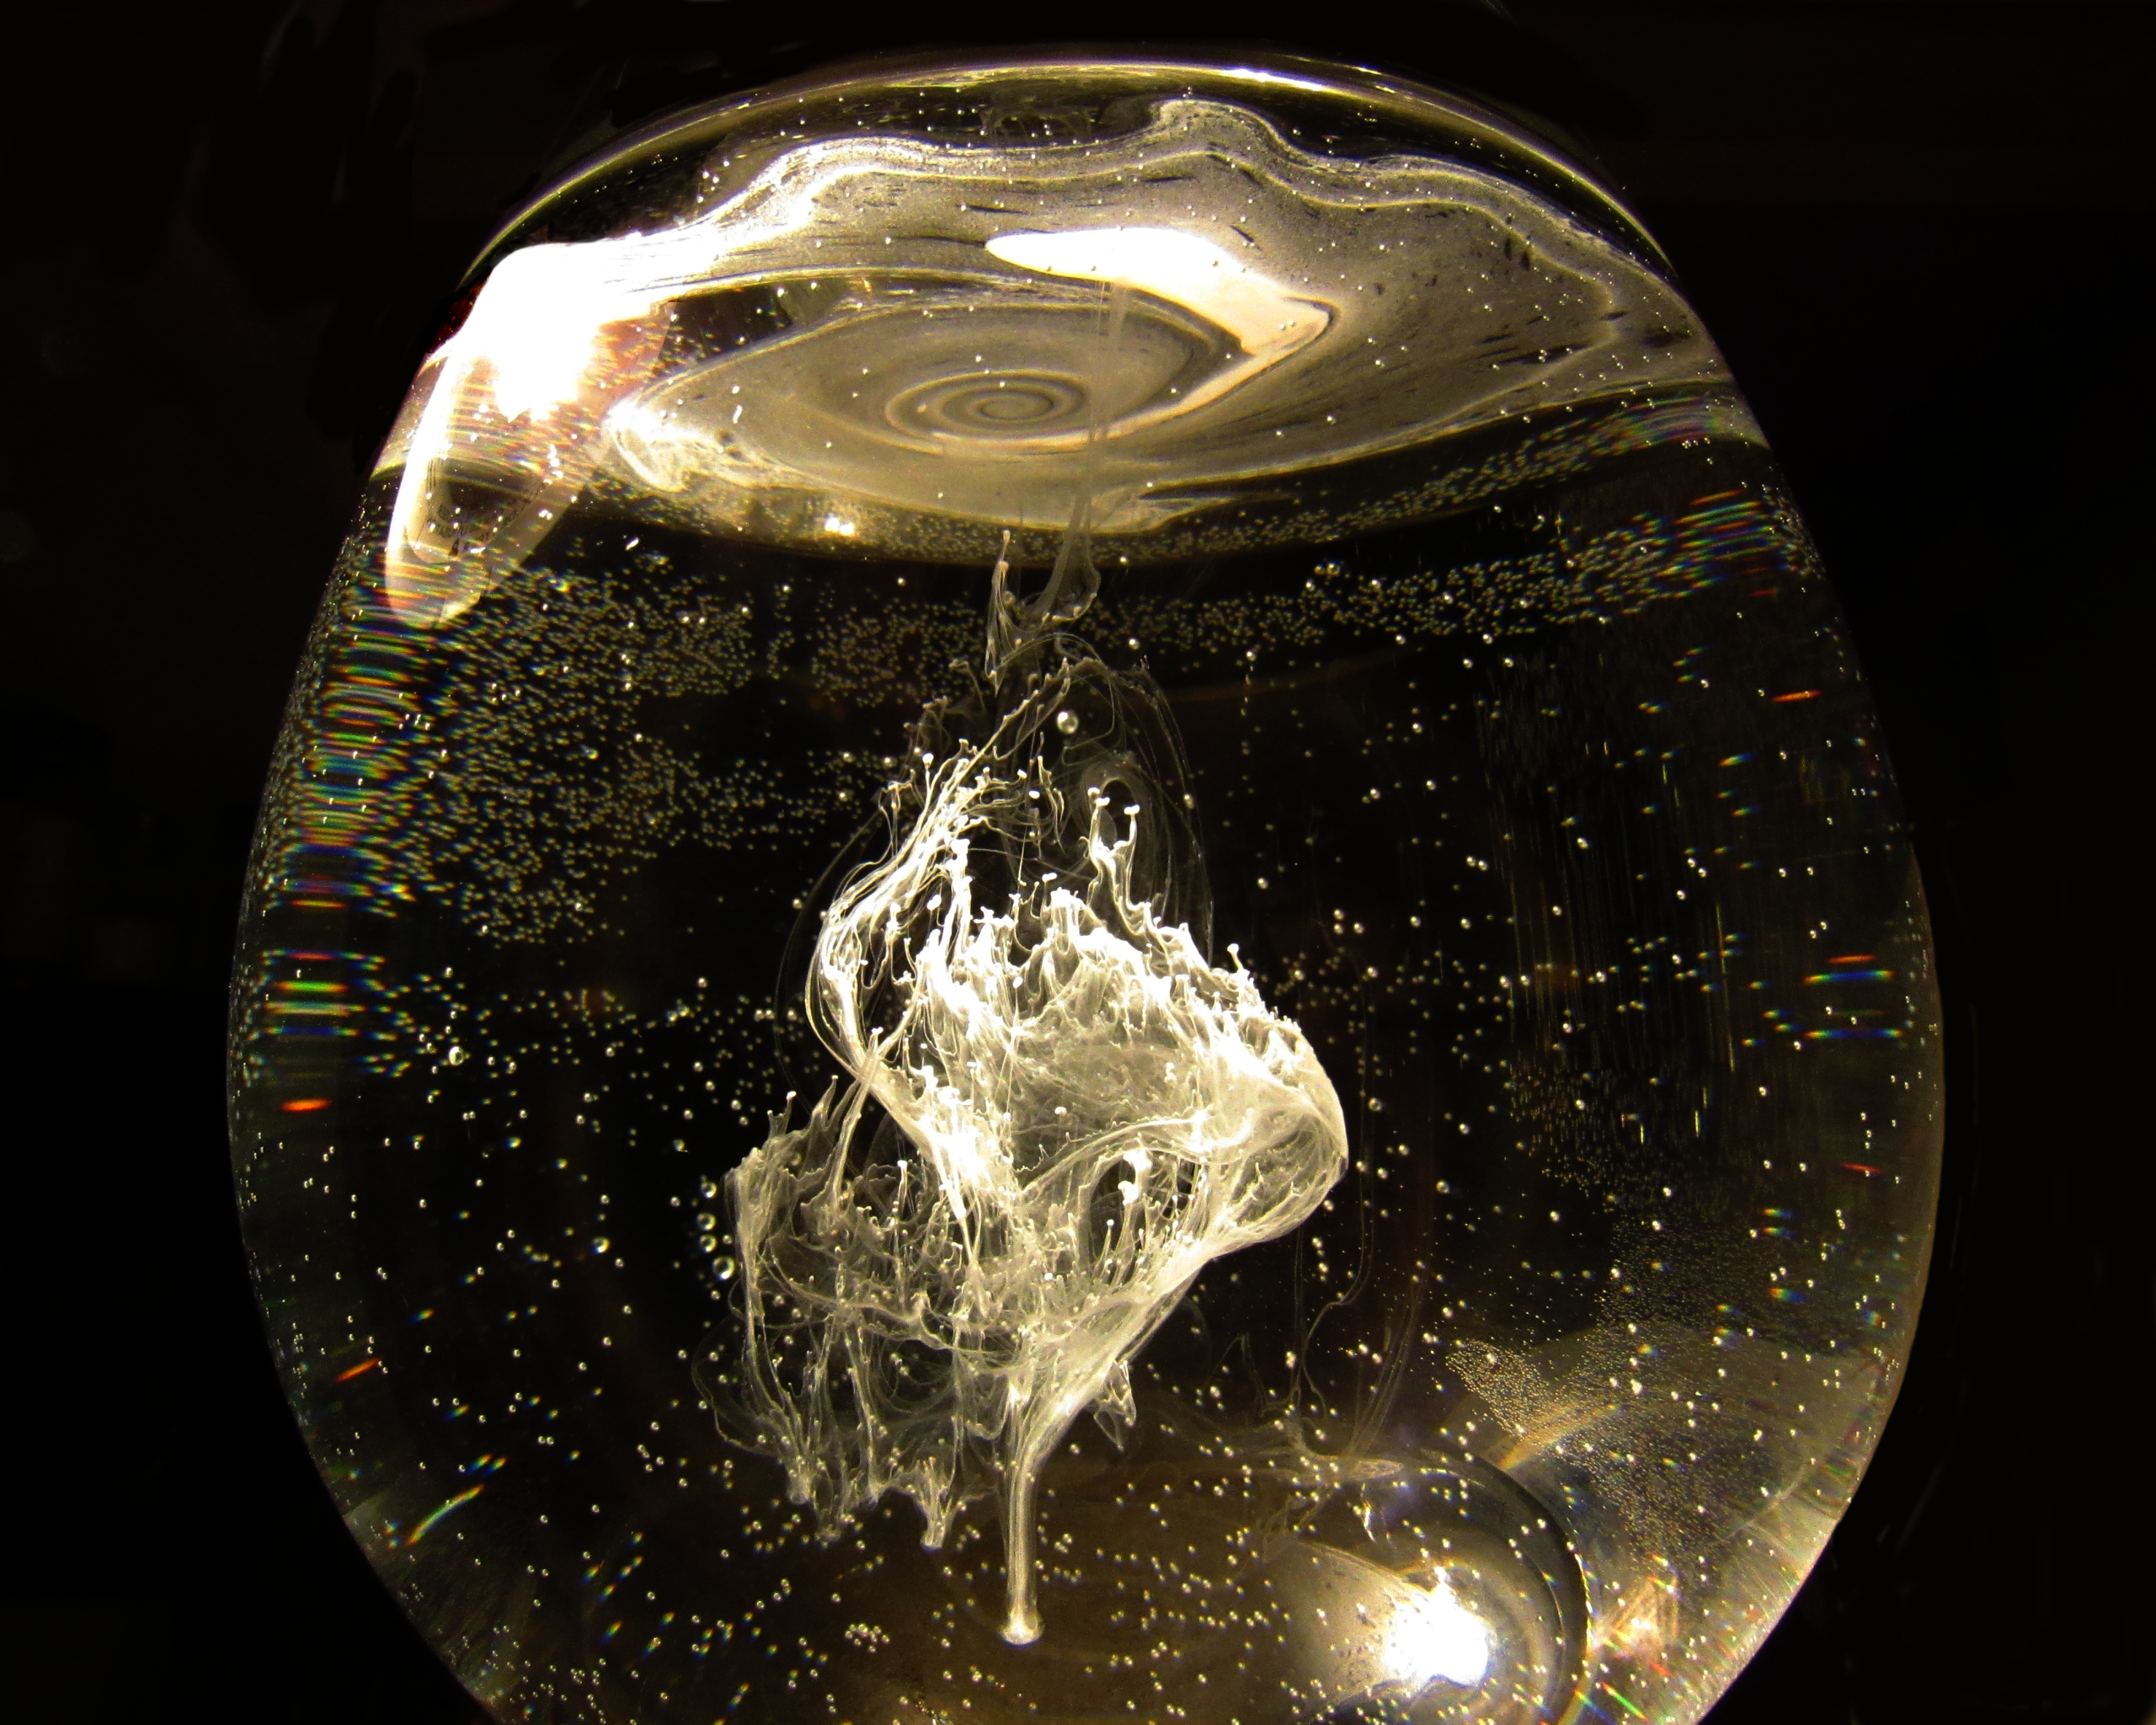
The purpose of this visualization was to capture the nature of whipping cream and the fluid dynamics that result from the billowing plumes that arise when it is dropped into a pool of water. The phenomena was initially observed by trying the experiment with cold whipping cream in warm water, which yielded interesting tower-like structures that would form out of a single drop. The shot was captured thanks to the help of my roommate, Allyssa, who dropped the cream into the water.
2 Apparatus
The apparatus used in the image was a wine glass filled with warm water at the highest temperature from the tap in my apartment, which falls in the range of 85°to 90°Fahrenheit. Bubbles that were going to appear at the foreground of the image were scraped from the inside of the glass, so as not to cause any focusing on the bubbles that would appear in front of the cream that would be dropped into the water. Then, a liquid dropper was filled with cold (kept in the refrigerator at 40°F) Grade A ultra-pasteurized whipping cream, which contains approximately 35% fat. The water was allowed approximately 1 minute of settling time before the dropper was held about an inch above the surface and a single drop was released. The visualization occurs approximately 20-25 seconds after the cream has been dropped and has had time to interact with the warm water. A diagram of the setup can be seen below.
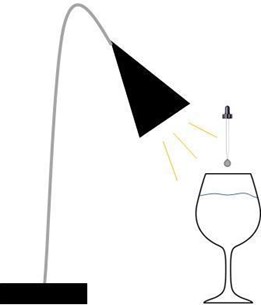
Visualization Set Up
The fluid phenomenon occurring in the image is largely due to positive buoyancy, meaning that the entering fluid tends to rise. The result of the cream rising in the warm water is a visualized “plume” which is a column of one fluid rising through another, and is directly driven by buoyancy. In Turner (1962), the author discusses the nature of this plume and how the cap of the flow moves at a slower rate than the column producing it, approximately 0.6 times the mean velocity of the columnar stream. This is significant for understanding why the cream accumulates at the top of each of the columns present in the flow, which can be attributed to its velocity in this case.
This positive buoyancy that is occurring between the liquids can also be attributed to several other fluid properties that were present in this setup. The first of these properties is density, which is different between the two fluids used. A general characteristic of the whipping cream is that it contains a significant amount of fat in it, which tends to rise. In most cases of milk preparation, this fat is “skimmed” from the top of a cream, hence the term “skimmed milk”. This image is a direct account of this fat rising to the top of the wine glass and accumulating in an aesthetically pleasing spiral form. Ihara et al. (2010) discusses the aggregation of more fat globules with increasing temperature as well, meaning that more fat builds up at warmer temperatures, thus increasing the buoyancy effects prevalent in the fluid. The fluid properties for water and whipping cream are listed in Table 1 below.
| Water | Heavy Cream | |
| Density (kg/m3) | 1000 | 994 |
Aside from simply having different densities at room temperature, the fact that the water was relatively hot also seems to increase the forcing effect of the fluid flow. These thermal forcing effects caused the reaction in the cream to happen a lot quicker than it would have in cold water. Later, the same experiment was attempted with cold water, which actually yielded less dramatic results (relatively slow movement and less columnar structures) since the similar temperatures did not cause any rapid forcing to occur in the cream. These reactions are due to the dependence of density on temperature. It was found that density does, in fact, change the flow scenario since the particles in the warmer liquid will move farther apart from each other and at a more rapid rate, as discussed by Plaza (2005).
The Reynolds number is a quantity of interest in this flow, to further understand the flow pattern at hand. The calculation for the Reynolds number is shown below, where the velocity of the flow was calculated based on the time a previous image of the flow was taken. To do this, the distance of the flow from the bottom of the 4.5" tall wine glass was compared to an average of where the flow appears in the final shot, which occurs 19 seconds later. This calculation for velocity in the y-direction is also shown below:
[latex]\begin{equation}v_y=\dfrac{δx}{t}\notag\end{equation}[/latex]
[latex]\begin{align}=\dfrac{0.0134m}{19s}\notag\end{align}[/latex]
[latex]\begin{align}=0.00070 m/s\notag\end{align}[/latex]
[latex]\begin{align}Re= \dfrac{ρvL}{μ}\notag\end{align}[/latex]
[latex]\begin{align}=\dfrac{(994 kg/m^3)(0.0007m/s)(0.0021m)}{(0.00289pa*s)}\notag\end{align}[/latex]
[latex]\begin{align}=0.51\notag\end{align}[/latex]
1 Visualization Techniques
The visualization technique used is known as a seeded boundary, meaning the milky liquid is the seeding fluid, and the transparent water does not scatter or absorb any light which makes the seeding fluid more apparent. This causes a clear boundary to be visible, especially against the dark background that was utilized for this image.
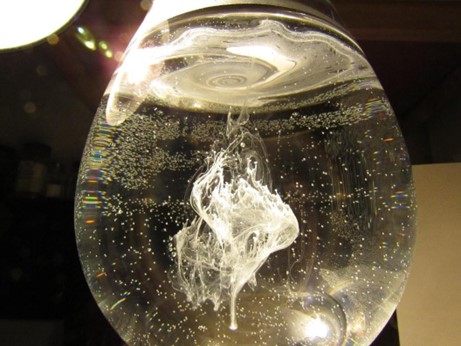
The lighting used was a spotlight lamp with a 4.5 Watt LED, which produces 200 lumens. The equivalent warmth for this light is 2700 Kelvin, which gives off a bright and relatively warm color. The lamp was placed with the mouth shining onto the top of the glass at a 45° angle from the vertical, and about 4 inches above the top of the glass as was shown previously in the diagram of the setup. The lamp can be seen in the upper left corner of the original image for reference in a later section. This was the only light source in the room, and all other lights in the surrounding area were turned off.
2 Photographic Techniques
The setup was approximately 6 inches away from the camera lens, while the focal length was 4.3 inches. The digital camera that was used to perform this visualization is a Canon PowerShot SX520 HS, with a focal length of 4.3-180.6mm, aperture 1:3.4-6.0. The settings used to capture the image are as follows:
- Shutter speed 1/60
- f/5.6
- ISO 800
The original image size was 4608 x 3456 pixels, while the final was 4320 x 3456 pixels. GIMP was used as the choice of image editing software, where post processing was performed to darken the black background behind the flow, and enhance the whites in the cream. This was achieved using the Curves feature by creating an “S” shaped curve. Also, the background of the original image has a piece of white paper as well as a visible spotlight that was edited out with the Paint tool by coloring over those features with black paint. Layers were also utilized to mirror the upper right corner of the wine glass onto the upper left side to eliminate the washed out corner from the bright LED light that was incident on that corner. Some cleaning up was done using the Dodge/Burn tool, which selectively brightens or darkens the area onto which the tool is applied, to cleanly blend this addition into the image. The original image is displayed below.
3 Image Thoughts
This image reveals the beauty of fluid physics in a very clear way. With a very simple combination of fluids, an aesthetically pleasing image is realized. I like the focus on the fluid phenomena that is happening, as well as the swirl occurring at the top of the image due to the accumulation of the fat in the cream. I also think that the bubbles add a nice touch to the feeling of the fluid being enclosed in the wine glass in an otherwise dark place. In the future I might attempt to dilute the lighting so as not to produce such a strong reflection in the glass. I attempted to edit the reflections out of the image, but it proved too difficult to achieve with my level of image editing capabilities. With that being said, I believe that I realized my intent with this image, by capturing the suspended milk in water very clearly and without altering any of the information associated with the fluid flow that is occurring. If I were to develop this idea further, I would choose to observe creams of different fat contents, since heavier creams might tend to produce larger positive buoyancy reactions and perhaps larger plumes. Another development could involve changing the temperature of the water and observing where the threshold of this thermal forcing truly occurs.
References
Ihara, J. et al. (2010). Influence of whipping temperature on the whipping properties and rheological characteristics of whipped cream. Journal of Dairy Science, 93(7). 2887-2895. https://doi.org/10.3168/jds.2009-3012
Plaza, R. J. (2006). Sink or swim: The effects of temperature on liquid density and buoyancy. https://csef.usc.edu/History/2006/Projects/J1532.pdf
Turner, S. J. (1962). The ‘starting plume’ in neutral surroundings. Journal of Fluid Mechanics, 13(3), 356-368. https://doi.org/10.1017/S0022112062000762
Appendix D: Website View Statistics
Detail of https://Flowvis.org website views by country for October 2023 through September 2024, downloaded from Jetpack site statistics. English-speaking countries are highlighted.
| Index | Country | Views | Index | Country | Views |
| 1 | United States | 17460 | 81 | Paraguay | 6 |
| 2 | India | 1153 | 82 | Georgia | 5 |
| 3 | Australia | 742 | 83 | Panama | 5 |
| 4 | Canada | 731 | 84 | Uruguay | 5 |
| 5 | Taiwan | 688 | 85 | Lebanon | 4 |
| 6 | United Kingdom | 635 | 86 | Kenya | 4 |
| 7 | Germany | 524 | 87 | Honduras | 4 |
| 8 | China | 436 | 88 | Azerbaijan | 4 |
| 9 | France | 380 | 89 | Latvia | 4 |
| 10 | South Korea | 346 | 90 | Bolivia | 4 |
| 11 | Brazil | 281 | 91 | Mongolia | 3 |
| 12 | Netherlands | 244 | 92 | Cyprus | 3 |
| 13 | Philippines | 202 | 93 | Zambia | 3 |
| 14 | Japan | 189 | 94 | Malta | 3 |
| 15 | Italy | 187 | 95 | Uzbekistan | 3 |
| 16 | Türkiye | 155 | 96 | Cambodia | 3 |
| 17 | Spain | 152 | 97 | Oman | 2 |
| 18 | Hong Kong SAR China | 148 | 98 | Bosnia & Herzegovina | 2 |
| 19 | Russia | 136 | 99 | Rwanda | 2 |
| 20 | Singapore | 135 | 100 | American Samoa | 2 |
| 21 | Indonesia | 128 | 101 | Macao SAR China | 2 |
| 22 | Mexico | 126 | 102 | Belarus | 2 |
| 23 | Belgium | 114 | 103 | Dominican Republic | 2 |
| 24 | Greece | 109 | 104 | Ghana | 2 |
| 25 | Poland | 105 | 105 | Guam | 2 |
| 26 | Israel | 99 | 106 | Guatemala | 2 |
| 27 | Thailand | 92 | 107 | Trinidad & Tobago | 2 |
| 28 | Denmark | 88 | 108 | Kosovo | 2 |
| 29 | Chile | 80 | 109 | St. Vincent & Grenadines | 1 |
| 30 | Sweden | 73 | 110 | Botswana | 1 |
| 31 | Switzerland | 72 | 111 | New Caledonia | 1 |
| 32 | Saudi Arabia | 64 | 112 | Belize | 1 |
| 33 | Finland | 64 | 113 | Montenegro | 1 |
| 34 | Nepal | 63 | 114 | Tanzania | 1 |
| 35 | Slovenia | 61 | 115 | Ethiopia | 1 |
| 36 | South Africa | 59 | 116 | Guernsey | 1 |
| 37 | Vietnam | 56 | 117 | Jamaica | 1 |
| 38 | Malaysia | 56 | 118 | Bermuda | 1 |
| 39 | Austria | 56 | 119 | Côte d'Ivoire | 1 |
| 40 | New Zealand | 53 | 120 | Cuba | 1 |
| 41 | Bulgaria | 48 | 121 | Libya | 1 |
| 42 | Pakistan | 48 | 122 | Zimbabwe | 1 |
| 43 | Czechia | 43 | 123 | Barbados | 1 |
| 44 | United Arab Emirates | 43 | 124 | Fiji | 1 |
| 45 | Norway | 42 | 125 | North Macedonia | 1 |
| 46 | Ukraine | 40 | 126 | Brunei | 1 |
| 47 | Bangladesh | 39 | 127 | Luxembourg | 1 |
| 48 | Ireland | 38 | 128 | El Salvador | 1 |
| 49 | Argentina | 34 | 129 | Albania | 1 |
| 50 | Colombia | 33 | 130 | Gibraltar | 1 |
| 51 | Romania | 32 | 131 | Eswatini | 1 |
| 52 | Egypt | 32 | 132 | Senegal | 1 |
| 53 | Slovakia | 32 | 133 | Namibia | 1 |
| 54 | Estonia | 29 | 134 | Mayotte | 1 |
| 55 | Portugal | 26 | 135 | Unknown Region | 1 |
| 56 | Tunisia | 26 | Total | 27543 | |
| 57 | Iraq | 24 | English speaking | 19621 | |
| 58 | Hungary | 24 | 71% | ||
| 59 | Peru | 23 | |||
| 60 | Nigeria | 21 | |||
| 61 | Sri Lanka | 19 | |||
| 62 | Puerto Rico | 18 | |||
| 63 | Qatar | 15 | |||
| 64 | Bahrain | 13 | |||
| 65 | Uganda | 13 | |||
| 66 | Armenia | 13 | |||
| 67 | Croatia | 11 | |||
| 68 | Algeria | 11 | |||
| 69 | Venezuela | 11 | |||
| 70 | Ecuador | 11 | |||
| 71 | Jordan | 10 | |||
| 72 | Iceland | 9 | |||
| 73 | Serbia | 8 | |||
| 74 | Madagascar | 8 | |||
| 75 | Kuwait | 7 | |||
| 76 | Morocco | 7 | |||
| 77 | European Union | 7 | |||
| 78 | Costa Rica | 7 | |||
| 79 | Lithuania | 6 | |||
| 80 | Myanmar (Burma) | 6 |
